
Faster, smoother Web maps with new browser features
A note from the co-chair:
The work of the Maps for HTML community group primarily focuses on proposals for new web standards for map viewers that would be built in to the browser. But we also care about making web maps better right now, in a Web that relies on JavaScript-based maps in HTML.
With built-in declarative content (that is, content defined using markup elements or CSS properties), browsers can implement a lot of performance improvements, such as pre-loading or lazy-loading content, and drawing or animating graphics in separate threads. Maps on the Web don’t currently benefit from any special optimizations, since the browser has no way of understanding what map content is or how users interact with it. And until recently, it wasn’t even possible for web map frameworks to recreate some of these optimizations with JavaScript.
This article by Andreas Hocevar describes the use of a new web platform feature, OffscreenCanvas, within a JS-based web map framework, to move graphics rendering to a separate thread. Andreas’ results give a taste of the performance improvements that a browser-optimized rendering pathway could achieve.
~ Amelia Bellamy-Royds, Maps for HTML CG co-chair
Summary
As an active developer of the OpenLayers mapping library, I have been working a lot on performance improvements in the rendering pipeline. Performance is usually good, but there are corner cases where the user experience is negatively affected by an unresponsive user interface. There is a new browser technology, OffscreenCanvas, which allows rendering in web workers that run in parallel to the main thread. Unfortunately it is not widely supported in mainstream browsers. In this post, I am going to show how rendering performance in OpenLayers could benefit from OffscreenCanvas.
Web maps and OpenLayers
Interactive maps have become very popular elements on web pages, and are key in applications that deal with geospatial information. We take their existence for granted. And still, unlike with pictures or videos, there is no HTML <map> or <geo> element for inserting a map in a web page. So instead of relying on native browser optimisations, we need mapping libraries that provide the user interface and use DOM- and JavaScript based APIs for loading, parsing and rendering of map data.
Interactive maps, where users can pan and zoom to any place in the world, have two bottlenecks when it comes to providing a smooth user experience: downloading data for the region of interest, and rendering it.
A popular and very flexible mapping library is OpenLayers. It supports raster and vector data in various formats, with static, tiled, and extent based fetching strategies. Vector data can be styled on the client with JavaScript functions. This means that not only attributes that are included in the data and the current view resolution can be used for rule-based styling, but any information from the application state.
Options for rendering graphics in the browser
The feature list of the OpenLayers library above shows it already: different techniques are available for loading and rendering map data in the browser, and there is a tradeoff for speed in download versus speed in rendering.
- The most basic technique is raster images, directly supported by the HTML
<img>element or the JavaScriptImageconstructor. Using CSS, images can be translated, scaled and rotated to respond to user interactions. Mutliple<img>elements can be stitched together from tiles. Download times increase with map size and screen resolution. Rendering is fast. Interactivity like style changes and querying requires additional data transfers, because all rendering happens on the server. - A smart native technique for rendering small amounts of vector data is the HTML
<svg>(Scalable Vector Graphics) element. Depending on the complexity of the data, initial download times of the XML that contains the vector data and styles can be long. Rendering gets slower with increasing number and complexity of geometries, and complexity styling. Once loaded, style changes and querying does not require additional data transfers. The fact that SVG relies on the DOM and CSS adds overhead if the interactivity and styling capabilities that it brings are not needed. - The HTML
<canvas>element is a container for any kind of graphics. It provides a 2d context with a high level API, and a WebGL context with a low level API similar to OpenGL, a popular native rendering technique optimized for deferring rendering to the GPU. Arbitrary raster or vector data can be rendered to the Canvas. If it is notImageor SVG, loading and parsing of the data is done in JavaScript, and rendering is done with JavaScript as well (on a 2d context), or with GLSL (on a WebGL context). When drawing from server-rendered raster images, additional data transfers are needed for style changes and querying, but if vector drawing methods are used then these can be computed in JavaScript.
Map rendering in OpenLayers
The primary renderer in OpenLayers uses <canvas> elements with 2d context as rendering API. It provides a maximum of flexibility for vector rendering, with on-the-fly style modifications based on JavaScript functions that have access to the whole application state. The <canvas> elements, which contain one or more layers each, are composed to the final map image using the DOM with CSS. This approach allows to mix rendering techniques on a per-layer basis. WebGL contexts are used for special point rendering use cases, like heat maps. With custom layer renderers, users can render any content to any DOM element, and the map renderer will take care of the final composition.
Performance considerations
OpenLayers generally performs well with raster data. For vector data, with average style complexity, the user experience will be fine with up to 5000 point geometries or line or polygon vertices in the visible map extent. Especially with street map vector tiles, these numbers can be exceeded in some regions at certain zoom levels.
The flexibility of OpenLayers poses limits on classic performance optimisations, where better performance is achieved by doing less work. This is especially a problem for the work that needs to be done with every render frame, where response to user interactions like zooming or panning and JavaScript calculations like label decluttering compete with native rendering for available frame time budget. Asynchronous loading and parsing of data and evaluating styles on resolution changes puts additional pressure on the available resources. The results are a blocked user interface and long frames that cause stuttering in animations.
Avoid a blocked user interface and stuttering
Consumers of interactive web maps are used to progressive loading of content. So there is acceptance for blurry images after zooming in until the full resolution data is available. It is ok if missing map data in corners on panning or zooming out takes a second or two to load. However, a user interface that does not immediately respond to user interactions is not acceptable in terms of user experience.
Improving rendering performance
If we cannot improve performance by doing less work, we need to parallelise the work we do and organise it in a way that we use already rendered data until better data for the currently visible extent has been rendered in parallel to any ongoing interactions and animations.
Some map viewers, such as Google Maps or Mapbox GL, use WebGL to separate the rendering performance from the UI performance. Mapbox GL JS is a mapping library that is optimized for rendering tiles. Vector styles are defined as JSON objects and support rules that are evaluated against the map’s zoom level and the data in the tiles. With these constraints, data can be pre-processed for rendering with little CPU effort. After uploading to the GPU, the hard rendering work can be done there, keeping the CPU free for responding to user interactions, loading and parsing. The same technique is used in OpenLayers for the special purpose WebGL points renderer. However, it does not integrate well with the dynamic styling and arbitrary JavaScript execution hooks used for vector layers.
OffscreenCanvas
For use cases that require the full flexibility of OpenLayers, we need to find a different way to parallelise user interface and rendering tasks. In browsers, this can be achieved using web workers. We started experimenting with workers in November 2018, at a code sprint in Saas Fee, Switzerland. But until now, we have not been able to make use of workers in the rendering pipeline.
A worker provides a limited context compared to the main thread’s Window, but we could easily offload loading, parsing and style evaluation. The result of this process is a set of render instructions, which is basically an array that represents the CanvasRenderingContext2D API calls. Because of the structure of these render instructions, they are not transferable back to the main thread. And because of their size, too much time would be spent if posted using a standard message.
So what about also doing the rendering in the worker? This is where OffscreenCanvas would come in handy. It was first introduced in September 2018 in Chrome. However, at this point, that is experimental technology, and still only available in browsers that use the Blink engine, like Chrome and Edge. In Gecko (Firefox), OffscreenCanvas is currently only available with WebGL context, and hidden behind an experimental flag. According to Bug 1390089 (offscreen-canvas), there is hope that it might be fully implemented later this year. For Webkit (Safari), Bug 183720 – Complete OffscreenCanvas implementation shows that the feature is being worked on, but does not mention any timeline.
With the hope that OffscreenCanvas might soon be supported in all major browsers, I created a proof-of-concept for OpenLayers that makes use of this technology. Starting with version 6.3, OpenLayers supports running the rendering process in a web worker, with an OffscreenCanvas as render target. An example shows how to use it. This is only a first step. In the future, as OffscreenCanvas support becomes more widely available, we could provide a convenient API to make seamless use of this technology.
Benchmarks
To measure the improvements we get from using OffscreenCanvas, I set up an animation sequence and applied it to the offscreen-canvas example. To compare with the situation without OffscreenCanvas, I applied the same animation sequence to the existing mapbox-style example. Both examples show the same map (except for the fonts, because we have not yet implemented web font loading in workers). The map is a very complex vector tiles map, which consists of five vector tile layers with data from three different tile sets.
Before we look at the numbers, let us compare how the animation sequence looks and feels. The videos below show the full sequence with saturated tile cache, i.e. most of the tiles that are involved in the animation are already loaded:
I recorded five animation cycles with the Chrome developer tools to collect performance data. Let us have a look at the performance without OffscreenCanvas:
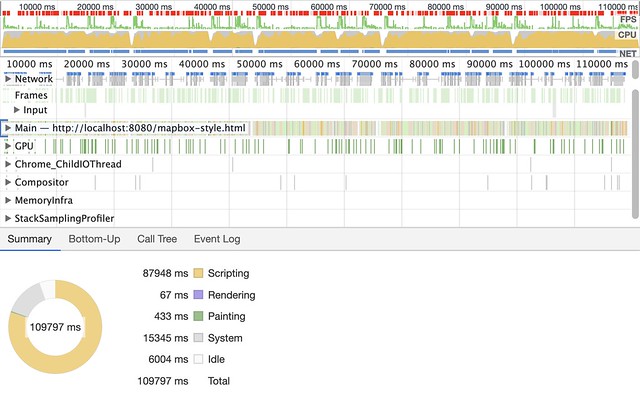
The pie chart at the bottom shows where time is spent. Note that the “Rendering” category only covers DOM rendering, which OpenLayers does not do much in a default setup. Canvas API calls are summarised under the “Scripting” category. The “Idle” category shows an idle time of only 6 seconds. This means that for the remaining 104 seconds, there is no time left to respond to user input, which causes a blocked user interface.
By introducing OffscreenCanvas, we can move a lot of the scripting time from the main thread to a worker. The graphic below shows the summary for the main thread when loading and parsing of data and style evaluation is offloaded to a web worker, and rendered to an OffscreenCanvas:
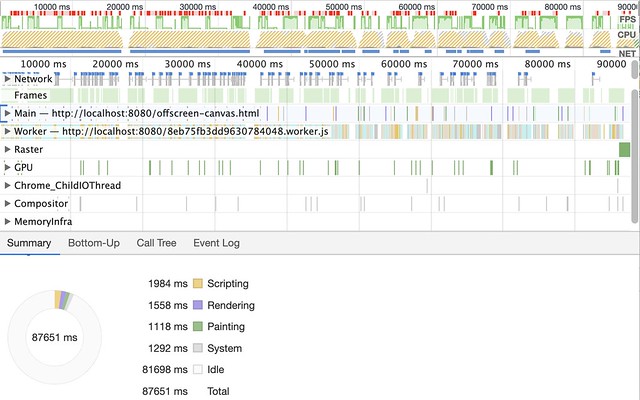
The first thing to note is the total time: with both examples, I recorded five animation cycles. The animation is time controlled, and five cycles should take 88 seconds. With OffscreenCanvas, this is exactly the total time shown in the summary chart. However, without OffscreenCanvas, it takes almost 110 seconds to finish five cycles. This is an indicator that the example needs more resources than the main thread can provide.
The second chart also shows that there is now enough idle time to respond to user input. Another thing to note is the increase in time spent in the “Rendering” (DOM rendering) category. This is because the main thread takes map images that the worker has already rendered, and applies a CSS transform to them to instantly respond to map zoom and center changes, while waiting for newer images from the worker. That’s the key feature for making the second example feel more responsive.
The graphic below shows how much work we are able to offload to the worker for the second example:
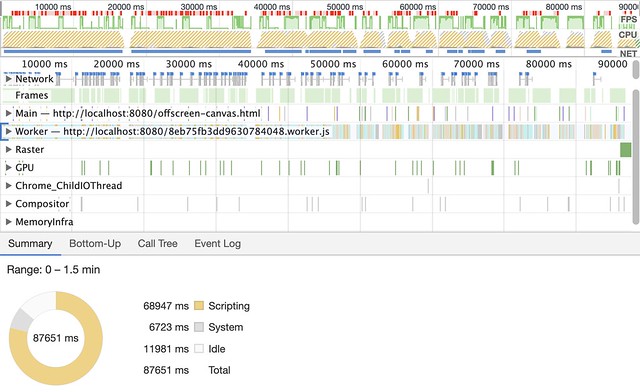
The summary pie chart shows clearly that there is still a lot of work to do. No surprise here, because we do not do less work than without OffscreenCanvas. This fact makes clear that the most important aspect of the improvements we achieve with OffscreenCanvas is the perceived responsiveness of the user interface.
With that in mind, we can the a brief look at some of the other numbers:
- FPS bar: the higher the green bars are, the higher the frame rate. The red bar above indicates times when the frame rate was too low to provide a good user experience. Without OffscrenCanvas, there is less green and more red. In fact, the frame rate almost never reaches the goal of 60 fps. On the other hand, with OffscreenCanvas, there are only drops in frame rate when data is being loaded and parsed (indicated by activity in the NET bar). These frame rate drops are compensated by the CSS transforms applied by the main thread, so the user still gets instant feedback to map interactions.
- NET bar: without OffscreenCanvas, the main thread is still busy loading tiles after five animation cycles, whereas otherwise, the worker has loaded almost all tiles after three cycles already
Outlook
Both the perceived improvements in responsiveness and the numbers show that OpenLayers can benefit from the use of web workers and OffscreenCanvas rendering. To integrate this technology nicely with the library, some architectural changes would be needed to make the renderers more asynchronous. That effort only makes sense when OffscreenCanvas is supported by all popular browsers on desktop and mobile. So we hope to see OffscreenCanvas with the 2d context API soon in Firefox and Safari.
Hi Andreas,
Firstly, I thank you a lot for this article, and for all your work in general! Congratulations!!
I have tested your example with the offscreenCanvas. I simplified it and used my own vector tile layers. The result is very impressive!
Then I tested it adding a simple background layer in the main file:
new TileLayer({
source: new TileJSON({
crossOrigin: ‘anonymous’,
url: ‘https://api.maptiler.com/tiles/satellite/tiles.json?key=…’
}),
zIndex: 1
});
and then the result became very, very… slow.
Do you have any idea about that? Do I need to create all my layers in workers? Can I create an image layer in a worker?
I thank you again, and if you have some time to give me an idea, it would be great!
Best regards!
André-François
Pingback: OffscreenCanvas, jobs, life – ChrisLord.net
Hey Andreas,
great article with so much insights!
I came across this article more than one year later and I’m wondering if decisions already have been made to implement this in any future release of openlayers?
Hey Arek, thanks for your interest! We’re waiting for at least one more major browser (Safari, Firefox) to implement OffscreenCanvas for Canvas 2D before we commit further to it in OpenLayers.
Any update on this?
No, unfortunately Chrome/Edge is still the only environment where OffscreenCanvas works with a 2D rendering context.
According to MDN, OffscreenCanvas is now supported by all the major browsers including firefox and Safari, as of March 2023.
https://developer.mozilla.org/en-US/docs/Web/API/OffscreenCanvas#browser_compatibility