SVG Accessibility/Chart Taxonomy
A description of a proposal by Fred Esch for how to annotate charts, maps, and other graphs with ARIA roles and properties, from July 2015. Compare with SVG Accessibility/ARIA roles for charts, a later proposal by Amelia Bellamy-Royds, which includes comments & discussion from the mailing lists.
See also Navigation_Experiments_2, a script to visualize the accessible features SVG marked up with this system.
Chart Taxonomy
This defines additions to the WAI-ARIA Graphics Module and describes the roles for charts.
Background
Roles play a big part in providing the user context for the components that make up a chart. Roles affect navigation and roles influence presentation to assistive technologies. In general, roles should be assigned to elements that have semantic meaning in the graphics. Elements without semantic meaning should be left without a role or given the role none. Charts are composed of three types of objects - regions, data and guides and roles need to reflect which type of object an element represents. Charts may include nested structures like stacked bars, which must be respected when navigating and presenting the chart to assistive technologies. And chart parts may be composed of explorable/navigable parts or may be atomic.
Note, in these discussions a default role may be assigned to an element and the element assumed to be semantically important when the user adds one of the following properties:
- aria-label
- aria-labeledby
- aria-describedby
Likewise, if an element has a child title or desc element, the element is assumed to be semantically important and may be assigned a default role.
Role types
Charts are composed of three types of objects- regions, data and guides. Chart regions are express via the graphics-figure role and chart regions are assumed to be explorable. Data related roles imply the element expresses a chart's data. Guide related roles imply the element is a guide object.
Data used in charts, is similar to data found in spreadsheets and databases and consists of columns and rows and is often thought of as a table. Some charts with connectors use two or more tables - one table for the nodes and a second table for the connectors. When we interpret charts we interpret the data in the chart.
Guides provide reference information and help us interpret the chart. Guides fall into two categories, scales (ie. axes, legends, dimension lines) and annotations (ie. titles, footnotes and arrows to call out info). The names of guides are often specific to a graphics domain. For instance, in statistical charts a positional guide an called an axis. A positional guide on a geographic map is called graticule or grid. On isometric diagrams positional guides are called dimension lines.
Explorable roles
graphics-datagroup, graphics-guide and graphics-diagram are subclasses of graphics-object and represents a section or a cohesive object with component parts the user may wish to explore. These roles imply that the element has semantic meaning and may have children with semantic meaning. A user should be able to navigate to an explorable element and optionally navigate inside the explorable object to visit the element's descendants (with semantic meaning). An element with an explorable role should have one of the following properties:
- aria-label
- aria-labeledby
- aria-describedby
or a title or desc child to provide a description of the (whole) element.
These roles are different from a group of distinct objects or roles like graphics-symbol and graphics-label which imply an element is atomic and not explorable.
Nested structures
Some charts like stacked bar charts contain nested structures. The nested structure can be expressed with group elements and by assigning an explorable role. Non semantic group elements (ie groups created for inheriting properties) should be assigned a role of none to distinguish them from meaningful nested structures and not given an aria property or a title or desc child.
List of Roles
graphics-annotation A type of guide object, usually a comment, explanation or note.
graphics-axis A graphics-scale often used with charts to show the scale of a dimension (variable).
graphics-connector A connector connects two data items, and may have a from/to relationship. A connector may form a loop, that is the from and to may be the same item.
graphics-datagroup Members in the data group represent data.
graphics-dataitem An object that represents a single data row.
graphics-dimensionline A line that defines the length of an object.
graphics-event Something defined or marked by an instant of time or time interval.
graphics-figure A distinct perceivable section of the page, that contributes essential meaning to the main page content, but is not part of a continuous stream of surrounding text.
graphics-graticule A network of lines representing the earth's parallels of latitude and meridians of longitude.
graphics-grid Two sets of parallel lines representing (constant) coordinate values.
graphics-guide A guide object.
graphics-label A visible label.
graphics-legend A scale for data representation. Legends may show any chart aesthetic (color, size, shape, etc).
graphics-scale A type of guide object, usually showing a reference for measuring.
graphics-symbol A graphic used to convey a simple meaning or category, where the meaning is more important than the particular visual appearance. It may be a component of a larger structured graphic such as a chart or map.
graphics-title A visible title.
aria-type
In this taxonomy a new aria property is proposed - aria-type (name TBD). The purpose of aria-type is to allow authors to designate when objects with the same role (and same semantic parent) should be considered different features for navigation. aria-type is an optional property whose value is a string. Use of aria-type is discussed in graphics-guide, Navigation Between Features, Directional Navigation and Paneled Box Plot.
aria-type is controversial. The name (aria-type), the value being a string (vs an enumeration) and being able to be optional on all graphics roles are all controversial.
Name
The name aria-type is a placeholder name used through out this taxonomy and will likely be changed.
String Value
Having a string value provides the author the capability to split elements with the same role (and same semantic parent) in custom ways that improve interpretation and navigation of the graphic. Custom splits are needed when using compound representations of data ( box and whisker plots, Chernoff faces and tradeoff analytics are examples of compound representations of data). Using aria-type can improve navigation of contours, lines, paths and areas which can have bizarre behavior when using directional navigation. Common uses of aria-type with guides include distinguishing between legends, axes, annotations and reference elements (lines, boundaries, areas, guide points).
Machine readability has been mentioned as a reason for having enumerations instead of a string for the value. However, using an enumeration does not allow custom splits which are needed for compound representations and providing custom navigation for problematic elements.
Global Applicability on Elements in Graphics
Only one property (aria-type) has been proposed. And aria-type can be used with any graphics role. Using a single (global graphics) property assumes, that regardless of the role an author will need the ability to create custom splits and needs a string value.
If it can be shown, that an exhaustive set of enumerated (aria-type) values could be created for a set of roles, then an property with enumerations could be used. This could improve machine readability.
Enumerations
An enumerated set of values for the graphics-graticule role are provided below:
- parallel
- meridian
Definition of Roles
graphics-datagroup
Members in the data group represent data. The graphics-datagroup role is a subclass of graphics-object. graphics-datagroup may have children with the following roles.
- graphics-datagroup
- graphics-dataitem
- graphics-label
- none
- Optional properties
- aria-type
graphics-connector
A connector connects two data items, and may have a from/to relationship. A connector may form a loop, that is the from and to may be the same item. A graphics-connector role is a subclass of a graphics-dataitem role. A graphics-connector may have children with the following roles.
- graphics-label
- graphics-symbol
- none
- Optional properties
- aria-type
graphics-dataitem
An object that represents a single data row. A graphics-dataitem may have children with the following roles.
- graphics-dataitem
- graphics-label
- graphics-symbol
- none
- Optional properties
- aria-type
graphics-event
Something defined or marked by an instant of time or time interval. A graphics-event role is a subclass of a graphics-dataitem role. A graphics-event may have children with any role.
- Optional properties
- aria-type
graphics-guide
A guide object. The graphics-guide role is a subclass of graphics-object. Guide objects may need a aria-type (name TBD) property to help navigation distinguish between two features of the same role. For instance, it will be common to have two axis on charts and both axes will have a role of graphics-axis. To tell the axes apart, aria-type should be used. So the x axis could have a role of graphics-axis and an aria-type of x and the y axis could have a role of graphics-axis and a type of y. It is not valid to assume all guides with the same role should be treated as separate features, for instance a nested bar chart may have multiple x axes at the same nest level which are part of the same feature and a user should be able to directionally navigate between the nested axes at the same level.
- Optional properties
- aria-type
graphics-annotation
A type of guide object, usually a comment, explanation or note. The graphics-annotation role is a subclass of the graphics-guide role. A graphics-annotation may have children with the following roles.
- graphics-label
- none
- Optional properties
- aria-type
graphics-axis
A scale often used with charts to show the scale of a dimension (variable). The graphics-axis role is a subclass of the graphics-guide role. A graphics-axis may have children with the following roles.
- graphics-label
- graphics-symbol
- graphics-title
- none
- Optional properties
- aria-type
graphics-dimensionline
A line that defines the length of an object. The graphics-dimensionline role is a subclass of the graphics-guide role. A graphics-dimensionline may have children with the following roles.
- graphics-label
- graphics-symbol
- none
- Optional properties
- aria-type
graphics-graticule
A network of lines representing the earth's parallels of latitude and meridians of longitude. The graphics-graticule role is a subclass of the graphics-guide role. graphics-graticule may have children with the following roles.
- graphics-label
- graphics-symbol
- none
- Optional properties
- aria-type
graphics-grid
A network of lines of constant value, usually associated with a value on an axis. The graphics-grid role is a subclass of the graphics-guide role. graphics-grid may have children with the following roles.
- graphics-label
- graphics-symbol
- none
- Optional properties
- aria-type
graphics-legend
A scale for data representation. Legends may show any chart aesthetic (color, size, shape, etc). The graphics-legend role is a subclass of the graphics-guide role. A graphics-legend may have children with the following roles.
- graphics-label
- graphics-symbol
- none
- Optional properties
- aria-type
graphics-scale
A type of guide object, usually showing a reference for measuring. The graphics-scale role is a subclass of the graphics-guide role. A graphics-scale may have children with the following roles.
- graphics-label
- graphics-symbol
- none
- Optional properties
- aria-type
graphics-title
A title. The graphics-title role is a subclass of the graphics-label role and also a guide. A graphics-title may have children with the following roles.
- text
- none
- Optional properties
- aria-type
graphics-label
A visible label. A graphics-label may have children with the following roles.
- text
- none
- Optional properties
- aria-type
graphics-figure
- Optional properties
- aria-type
graphics-symbol
- Optional properties
- aria-type
Examples
Examples of marked up charts and an example implementation of chart navigation is provided below.
An example implementation of chart navigation is provided in File:SvgNav.zip (38 KB). After unzipping the file, you should be able to go to the ht directory and double click on nav8Tax.html, load a marked up file from File:SvgTaxMarkup.zip (45 KB) using the file chooser, tab to the div containing the SVG and navigate the chart. The navigation keys are given below and in the table on the navigation page (nav8Tax.html).
Chart structure and features
Charts are composed of three types of semantic objects - regions, data and guides. Chart regions are express via the graphics-figure role and chart regions are assumed to be explorable. Examples of regions in charts are the panels in the paneled box plot and the two charts in the two graphs example. Data is expressed as elements in a chart. These are the bars in bar charts, points in a scatter plot and lines in a line chart. Charts without data don't give the user useful information. Annotations, axes, titles and legends are examples of guides in a chart.
In this section, a feature refers to an entity with semantic meaning. A chart title is a feature that may consist of a single line of text. An axis is a feature and may consist of different parts - title, major ticks, minor ticks, labels and axes line. Data features usually refer to the set of data expressed in the same way/representing the same column of data. For instance the bar chart has one data feature - the bars. The histogram has two data features - the bars and the fit line. Even data features may have data items with parts, for example, each item in the paneled box plot can be broken down into the range, quartile and median. The stacked bar chart's data feature consists of the collection of stacks. Each stack is composed of individual bars.
In this section, structural navigation refers to movement up and down the structural levels of a chart. See Structural Navigation for details.
The example navigation supports:
- Structural Navigation
- Navigation between Features
- Directional Navigation
Navigation using connectors is not supported.
Charts may be hierarchical and have multiple levels. For example, the paneled box plot has 5 structural levels:
- the chart (SVG) level
- the panel (graphics-figure) level
- the chart feature level
- the data row level (individual box and whiskers)
- the item part level (range, quartile, median)
And in order to explore the chart a user must be able to move between the structural levels. The example implementation allows a user to move into a explorable item and out of explorable items. Keys for moving into and out of an explorable item are given below:
- Enter key moves into an explorable item
- Esc key moves out of an explorable item
Features are semantic objects used in building a chart. Axes, data elements and legends are examples of features. Features are distinguished by role and aria-type. Semantic items with the same semantic parent, with the same role and same aria-type are defined to be in the same feature. A feature cycle consists of the features with the same semantic parent.
The sample implementation allows you to move between features using the spacebar. Features are cycled through in the order they appear in the DOM and the cycle forms a never ending loop. The keys for moving between features are given below:
- spacebar moves forward through the feature cycle (loop)
- shift + spacebar moves backward through the feature cycle (loop)
It may make more sense to loop through features front to back, which will be generally the last drawn feature first instead of the first drawn feature first, since being drawn last often implies more significance in a chart.
Directional navigation only occurs within a feature. That is, directional navigation only occurs between semantic items with the same semantic parent, with the same role and aria-type. The eight directions for movement include the 4 cardinal directions and the diagonals. The navigation implementation uses the arrow keys and numeric keypad equivalent keys. Listed below are the move directions and in parenthesis the keys:
- north (↑ or 8)
- northeast (↗ or 9)
- east (→ or 6)
- southeast (↘ or 3)
- south (↓ or 2)
- southwest (↙ or 1)
- west (← or 4)
- northwest (↖ or 7)
Wrapping, that is looping from the farthest to the nearest is not included in the sample navigation implementation. Some folks like wrapping on some features such as axes and not on others like data elements. Providing authors a way to designate whether a feature should wrap or not has not been included in the taxonomy or the sample navigation implementation.
The sample navigation code has a bug in which you may have to use to use the opposite arrow key (down instead of up) when navigating between graphics-figure objects. I haven't determined whether this is a SVG bug or navigation code bug.
For leaf elements the getBBox() function is used (navItem.js line 30) along with the getTransformToElement() function (navItem.js line 45 to get a consistent set of coordinates to use with directional navigation. The svg in line 45 is the outermost SVG element. Note that with use elements the baseVal must be added to the coordinate.
For elements with semantic children, the children's coordinates are used instead of calling getBBox(). An exception is when an element has a role of graphics-figure, then getBBox() is used as it seems to help in some cases compared with using the children's coordinates (svgNavigation.js line 168). Oddly, even trying to use getBBox() does not always make directional navigation between graphics-figure work correctly.
The charts where graphics-figure affects navigation are Paneled Box Plot (2) and Two Graphs.
Sample Charts
All sample charts marked up with the chart taxonomy are in File:SvgTaxMarkup.zip (45 KB) and can be used with the sample navigation implementation. A couple of files did not produce thumbnails when uploading or may not have uploaded as individual files.
A simple bar chart
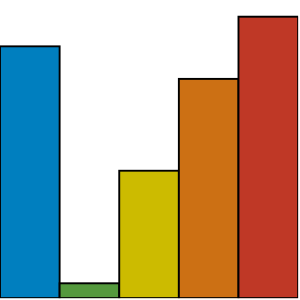
This chart has only bars and is the simplest form of a chart.
A histogram with curve fit
A histogram with axes and a curve fit of data. (This file had trouble uploading and is included in the File:SvgTaxMarkup.zip file.) This file shows how aria-type can be used to distinguish between the x and y axes.
A Chloropleth map
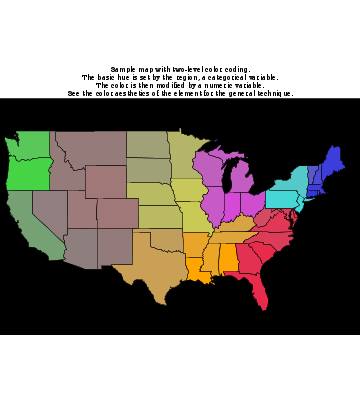
A chloropleth map of the continental US. Has an explorable annotation at the top.
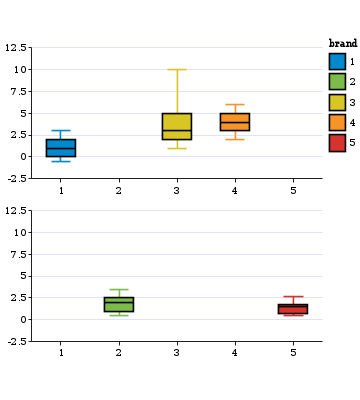
Paneled Box Plot
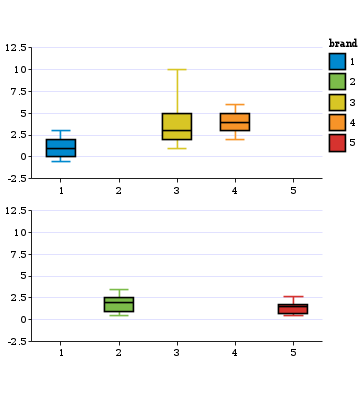
A paneled box plot. Uses aria-type to allow a user to navigate between the parts of the box and whisker using the spacebar, if they wish. aria-type provides an author fine control over structure within a feature and would be even more important for box and whisker plots that include outliers. Note this is the same as the paneled box plot below except a user navigates between panels (graphics-figure) using the spacebar as the author has decided that the two panels should be treated as different features.
Paneled Box Plot (2)
A paneled box plot. Note this is the same as the paneled box plot above except a user navigates between panels (graphics-figure) using the arrow keys as the author has decided that the two panels should be treated as siblings.
Rec Track
The recommendation track of the W3C. This example supports directional navigation, but does not connectors. In the future a version of this diagram may use connectors.

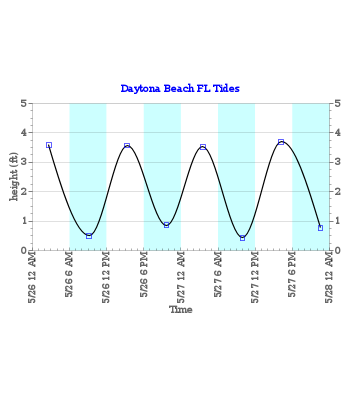
Tide Chart
A chart showing tides in Daytona Beach FL. In this chart the author chose to only allow high and low tide to be navigated.
Two Graphs
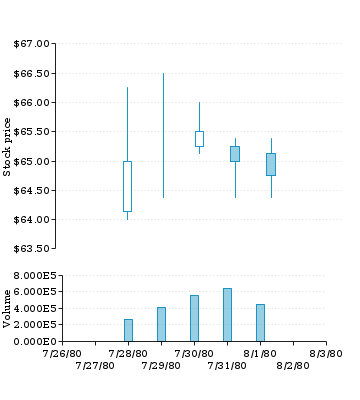
A visualization with two related charts that share an x axis (date) and show two aspects of stock trading. The upper chart shows the trading range and the lower chart shows the volume traded.
