DRAFT Web Accessibility for Older Users

Editors Draft:
26 March 2009 [changelog]
Previous draft (19 February 2009)
Status:
This document is an in-progress Editor's Draft.
Please send comments to public-comments-wai-age@w3.org (with public archive).

IMPORTANT: Instructions

The Notes section for each slide contains important information. Make sure you can read the Notes. On this slide, the notes start with "[NOTES SECTION: This is where the important information is ...]"

Copyright © 2009 W3C® (MIT, ERCIM, Keio)

Notes

[NOTES SECTION This is where the important information is: for each slide.]

@@ A Power Point presentation version of this material is also available [tba]

Permission and Reference

If you plan to use this material for a presentation, please let us know by sending an email to wai-eo-editors@w3.org (a publicly-archived list), or if you do not want it public send it to wai@w3.org. Following your presentation, we would appreciate knowing how many people attended, what questions they had, and how it was received. We also welcome your feedback and suggestions for the presentation.

The "Web Accessibility for Older Users" presentation material is copyright© W3C and licensed under the W3C Document License, with the exception of some of the images. Additionally, you are granted permission to create modifications or derivatives of the material.

All that means that you can copy, change, translate, distribute, and present the "Web Accessibility for Older Users" presentation material as long as you include the reference information below as source material:

Web Accessibility for Older Users, A.M.J. Arch, ed. W3C (MIT, ERCIM, Keio), February 2009. www.w3.org/WAI/WAI-AGE/@@@@

Images

Credits for the images and information, and permission to use any images, are included in the Notes section where the image or data first appears.

Note to presenters:

Web Accessibility for Older Users
Findings from the WAI-AGE Project

Last Updated 26 March 2009

Notes

Welcome!

Presentation Overview

@@ check Outline bullets from this slide when document finished

Notes

Today I'll be talking about the WAI-AGE project that is looking at the requirements of older people using the Web.

The presentation will introduce the project, talk about the changing worldwide demographic situation, introduce some of the findings from a literature review, highlight some of the requirements of older users, and talk about the current activities of the project.

WAI-AGE Project
(WAI Ageing, Education and Harmonisation)

European Commission funded project focused on:


WAI-AGE Project information

Notes

The Web Accessibility Initiative: Ageing Education and Harmonisation (WAI-AGE) project is funded as a European Commission IST Specific Support Action with the goal of increasing accessibility of the Web for the elderly as well as for people with disabilities in European Union Member States.

The project is specifically intended to:

Much more information is available from the Project page at www.w3.org/WAI/WAI-AGE/

Let's first look at the motivations behind this project ... changing demographics and ageing-related impairments [next slide]

Looking forward

Forecast changes in world demographics

United Nations is expecting:


Source: UN World Population Prospects

Notes

The United Nations has forecast that "Globally, the number of persons aged 60 years or over is expected nearly to triple, increasing from 673 million in 2005 to 2 billion by 2050" while at the same time, the total population is only forecast to increase by 40%. They also state that "Today, about half of the oldest-old [those over 80 years] live in developing countries but that share is expected to reach 71 per cent in 2050". At the same time, they expect the working-age population to decline by 5%.

Note to presenters:
Several slides are provided in the Appendix with specific country demographic forecasts for you to select from
- you will probably just select one or two.
The point to emphasize is that the population is getting older.

Note: The UN defines 'working-age' as 15-59 years while Europe uses 16-65 years.

UN References:
http://www.un.org/esa/population/publications/wpp2006/WPP2006_Highlights_rev.pdf
http://www.un.org/esa/population/publications/wpp2006/wpp2006_ageing.pdf

European situation

An increasing older population

EuroStat forecast the following changes:

Year
over 50 years
over 65 years
over 80 years
2010
36%
17%
5%
2020
41%
20%
6%
2030
44%
24%
7%
2040
46%
27%
9%
2050
47%
29%
12%


Source: EuroStat (PDF)

Notes

In the European Union, the EU-27 group of countries are predicted to to have nearly 30% of its population over 65 years by 2050, up from 17% in 2010 to 20% in 2020, 24% in 2030, and 27% in 2040. The proportion of older-old (those over 80) will also increase - from 5% in 2010 to 12% in 2050.

Many countries will experience different changes from this - some are forecast to have greater proportions of older people, others to have lower proportions of their populations over 65 years. For example Ireland is forecast to grow from 11% in 2010 to just 24% in 2050, while Italy is forecast to grow from 23% in 2010 to 33% in 2050.

Other countries will also experience greater growth - for example, Japan is expected to have 1/3 of its population over 65 years within 30 years!

Note to presenters:

References:
http://epp.eurostat.ec.europa.eu/cache/ITY_OFFPUB/KS-SF-08-072/EN/KS-SF-08-072-EN.PDF (PDF) for 65+ and 90+
http://epp.eurostat.ec.europa.eu/portal/page?_pageid=0,1136184,0_45572595&_dad=portal&_schema=PORTAL for 50+
Definitions:
"EU-27" represents the 27 countries that comprised the EU as at 1 January 2007

Europe's age ratios

Graph of EU-27 old to young (old-age dependency) ratios

Increasing ratio of older people to younger people


This data highlights the Europe population forecast for people over 65 as a percentage of those aged 16-64 years.


Source: EuroStat (PDF)

Notes

This table highlights the forecast differences across Europe over the next four decades between the numbers of older people and those in the so-called working age group.

In 2005, most countries were close to the EU average of 1 person over 65 for every four of working age (1:4).

The EU average in 2010 will be 26%, forecast to rise to 38% in 2030 and 50% in 2050.
Some individual countries within the EU vary considerably from the average.
[e.g. in 2030, Netherlands - 37%, Austria - 41%, and Italy - 45% compared with the EU-27 average of 40%]

These forecast changes between older people and younger people over the next few decades show that the older group is going to be more significant and emphasizes the need to:

  1. support older people in the workplace (note that many EU countries are currently raising the retirement age and people are also choosing to work longer) and
  2. support older people in the community

An accessible Web contributes to this.

Note to presenters:
European presenters may like to extract the percentages for their own country

Reference:
http://epp.eurostat.ec.europa.eu/cache/ITY_OFFPUB/KS-SF-08-072/EN/KS-SF-08-072-EN.PDF (PDF)
(see also the Eurostat Yearbook [PDF])
Definitions:
The EuroStat term of "old age dependency ratio" is the ratio of the population aged 65 and over as a % of the working-age population
"working-age population" is defined by EuroStat as people between 16 and 64 years of age (UN definition is 15-60 years)
"EU-27" represents the 27 countries that comprised the EU as at 1 January 2007

Ageing and Functional Impairments (statistics)

Vision decline

Hearing loss

Motor skill diminishment

Cognitive limitations

NB. Two slides about "Ageing and Functional Impairments" are provided - this one shows statistical information about the prevalence of various impairments, the following shows the impacts. Select only one depending on your audience. For example, an audience of managers might be more interested in the statistical prevalence; an audience of developers might be more interested in the impairment impacts they need to accommodate.

Notes

Impairment often accompanies the ageing process - vision loss, hearing loss, motor skill diminishment, cognitive decline.

Vision decline often starts in a person's mid-40s. It affects 16% of people 65 to 74 years, but 46% of those over 85 years. In older people vision decline includes:

Hearing starts to decline at around 50 years, affecting 19% of people 61 to 80 years but 75% of people over 81 years.

Motor skill diminishment includes arthritis, with joint stiffening, and Parkinson's Disease, with associated hand trembling, making mouse use difficult or impossible for some. Arthritis is estimated to affect at least 50% of people over 65.

Cognitive impairment is also common. While Dementia affects part of the older population (1.4% of people 65-69 years increasing to 24% of people over 85 years), forms of mild cognitive impairment (or MCI) are much more common affecting over 20% of those over 70 years. MCI can result in:

These statistics, and other information, show that ageing-related impairments commonly start to be experienced from around 50 years of age (i.e. while most people are still in employment) and also that there is a significant increase in the proportion who experience these impairments after around 80 years of age.

Note to presenters:

Ageing and Functional Impairments (impact)

Vision decline:

Hearing loss:

Motor skill diminishment:

Age-related cognitive limitations:

Notes

NB. Two slides about "Ageing and Functional Impairments" are provided - this one shows the impacts various impairments, the following shows statistical information about their prevalence. Select only one depending on your audience. For example, an audience of managers might be more interested in the statistical prevalence; an audience of developers might be more interested in the impairment impacts they need to accommodate.

Impairment often accompanies the ageing process - vision loss, hearing loss, motor skill diminishment, cognitive decline.

Vision decline often starts in a person's mid-40s.

Hearing often starts to decline at around 50 years

Arthritis (one form of motor skill diminishment) is estimated to affect at least 50% of people over 65.

Cognitive impairment is also common. While Dementia affects part of the older population (1.4% of people 65-69 years increasing to 24% of people over 85 years), forms of mild cognitive impairment (or MCI) are much more common.

Prevalence statistics show that ageing-related impairments commonly start to be experienced from around 50 years of age (i.e. while most people are still in employment) and also that there is a significant increase in the proportion who experience these impairments after around 80 years of age.

Note to presenters:
For a short presentation, remove the bulleted lists and speak very briefly to the main areas of vision, hearing, motor skills, and cognition.
More detailed data is available from Web Accessibility for Older Users: A Literature Review

Implications

Population is ageing


At the same time, online participation is developing and expected in:

Web Accessibility becomes an imperative

Notes

These previous statistics are leading to working ages being extended, and with that goes lifelong learning, but with the issue of age-related impairments being increasingly experienced.

At the same time all forms of community participation are going online, and participation is expected and being encouraged ... [read list]

Older people are expected and wanting to participate, and are being encouraged and supported to do so if they aren't online already.

What have we found about older people and their Web accessibility requirements?

Understanding the needs

An extensive Literature Review was undertaken including literature which:

See "Web Accessibility for Older Users: A Literature Review" for details

Notes

To better understand the needs of the ageing population, the WAI-AGE Project undertook an extensive Literature Review. This review included a broad range of literature including scientific papers and popular articles. The range of literature reviewed included those that ... [read out the bulleted list]

Observations from the literature review

Notes

In reviewing the literature, the Project found that:

Accessibility accommodations

Requirements overlap with those for people with disabilities:

Web Content Accessibility Guidelines (WCAG) 2.0 address these

Notes

Many of the requirements for making websites accessible to people with disabilities match the requirements of older users:

WCAG 2.0 addresses these requirements

See WAI Guidelines and Older Web Users: Findings from a Literature Review for full details of coverage.

Usability improvements

Usability assists older people and people with disabilities:

WCAG 2.0 is also addressing more of these areas

Notes

Usability features also overlap with the requirements of people with disabilities

WCAG 2.0 covers more usability requirements than previously - this will assist older people and people with disabilities

See WAI Guidelines and Older Web Users: Findings from a Literature Review for full details of coverage.

Importance of WCAG 2.0

Best practices meet the needs of older users

The advisory techniques from WCAG 2.0 can be as important as the sufficient techniques for some people. For example, the following illustrative advisory techniques will minimize many of the barriers identified for older users:

[Read out the slide - it gives examples of WCAG advisory techniques that are particularly important to some older people]

Some of these techniques could be addressed via the browser ... [see next slide]


Note to presenters:
...

Browser and application usability

Complex interfaces slow the interaction

Poor usability combined with inexperience and impairment can lead to confusion


WAI's User Agent Accessibility Guidelines (UAAG), Authoring Tool Guidelines (ATAG) and Accessible Rich Internet Applications (WAI ARIA) can help address these issues.

Notes

Many older people, and especially the older-old (over 85 years) are often new to computers and the Web - facing a steep learning curve. While this situation will decline as more older people come online and gain experience, it is still a contributing factor at present.

Some studies of training older people in Web use found that a simplified browser interface aided learning and understanding, though many of them wanted a browser with additional features as their familiarity and experience grew. The lack of studies discussing adaptive strategies like changing text size or color schemes suggests that browsers could make these accommodation more obvious and available to users. Trainers and supporters of older people online need more information about how to adapt the user agent, or even the operating system, to accommodate the impairments they may be being experienced.

In other situations, older people may not notice changes that occur within a page due to a condition described as "change blindness".

The Web is also about contributing as well receiving information. The rise of online office-style applications and social networking and resource sharing opportunities is as attractive to older people as it is to younger people. However, older people with impairments experience many of the same problems as people with disabilities in accessing some of these newer Web developments.

The User agent Accessibility Guidelines, WAI's Accessible Rich Internet Applications, and the Authoring Tool Accessibility Guidelines can help make the learning process easier and Web interactions better.

More information on WAI guidelines:

Other Observations from Literature

Notes

Some other observations were made from the literature:


Ongoing work for the project

@@ Remove this slide?

Notes

The project has been interacting with WAI Working groups and providing some ideas for consideration in forthcoming guidelines or as techniques for existing guidelines.

One of the identified issues has been the duplication of work in this area and the potential for divergence. The propjet has found that older people and people with disabilities have a lot of requirements in common and we need to encourage the researchers, developers and community to work more closely together for an accessible web.

Much of the remainder of the project will concentrate on incorporating the requirements of older people into existing WAI documents and developing new documents to help promote the need for including older people as well as people with disabilities during the development of websites and web applications.

WAI working groups

@@ Remove this slide? Or place somewhere else in the sequence?

The W3C Web Accessibility Initiative charters a number of working groups, the three working on guidelines are:

Other groups are involved in Evaluation Tools, Education and Outreach, and Research and Development

See www.w3.org/WAI/groups.html for participation details

Notes

WAI has Working Groups developing accessibility guidelines and related work, and Interest Groups providing a forum for discussing Web accessibility issues.

The Authoring tools working group develops guidelines, techniques, and supporting resources for Web "authoring tools" (the software that creates Web sites, including the content management systems, blogs, and social networking websites)

The User Agent working group develops guidelines, techniques, and supporting resources for Web "user agents" (including Web browsers and media players)

The Web Content (WCAG) working group develops guidelines, techniques, and supporting resources for Web "content" (the information in a Web site, including text, images, forms, sounds, and such, as well as the interactivity) and released WCAG 2.0 at the end of 2008.

These three sets of guidelines are crucial for the future of an accessible Web. For Web users the content is important (WCAG), but that content has to be created appropriately (ATAG), and the content has to be accessed (UAAG).

Other groups are involved in Evaluation Tools, Education and Outreach, and Research and Development - see the working groups website for details (http://www.w3.org/WAI/groups.html).

WAI documents to include ageing considerations

A range of existing WAI documents will be revised, including:

Some new documents will be prepared, including:

Notes

Many existing WAI documents will benefit from having the needs of older users more explicitly considered. These include:

New resources are planned to build on the Project's findings and the benefits of WCAG 2.0. These include:

The planned revisions are all discussed at http://www.w3.org/WAI/WAI-AGE/deliverables.html

Become involved

You are invited to take part by:

Notes

Anyone interested in this topic is invited to:

Note to presenters:

Research needed

Some gaps that need to be investigated:

Notes

Some of the gaps in our understanding of the requirements of older people using the Web relate to:

Note to presenters:
Depending on your audience, this slide may not be relevant.


Questions

WAI Web site:

Project page:


The WAI-AGE Project is supported by:

6th Framework Programme 2002 to 2006

Notes

Note to presenters:
Before asking for questions, please mention that the WAI-AGE Project is a European Commission IST Specific Support Action funded by Sixth Framework Programme.


Appendix

Additional material that can be drawn on depending on the audience.

Demographics - you may like to select from among the following slides for your own country:


Notes

Note to presenters:

Keep the total demographics slides to 3 or 4 as a maximum - the main message is that population demographics are changing and the population is getting older (very quickly in some countries).

United Kingdom's ageing population

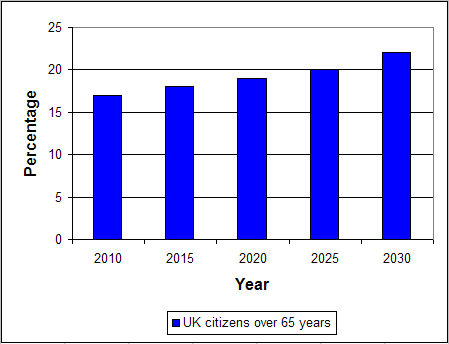
Graph of UKL population projections

Population over 50 years

  • 2010: 35% (21.5m people)
  • 2020: 38% (25.3m people)
  • 2030: 39% (27.6m people)

Population over 65 years

  • 2010: 17% (10.3m people)
  • 2020: 19% (12.7m people)
  • 2030: 22% (15.4m people)


Source: UK Office of National Statistics

Notes

This slide shows the ageing trend in the UK ... the number of people over 50 years will rise from 35% in 2010 to 38% in 2020 and 39% in 2030, while the population over 65 years will rise from 17% in 2010 to 19% in 2020 to 22% in 2030 (and by 2030, the UK is forecast to have 53,000 people over 100 years!). At the same time the proportion of 'older old' (over 85 years) is expected to increase from 2.2% in 2010 to nearly 5% in 2030.

While the proportion over 50 years is not forecast to grow as rapidly as the proportion over 65 years, it does represent people still in the workforce who may be starting to experience some age-related impairments such as vision and hearing decline (for instance the proportion of people with hearing loss increases sharply at around age 50, and 10% of UK blind and partially sighted people are in the 50-64 age group [76% are over 65 years]).

Note to presenters:
Don't forget to read the numbers out for those who may have low vision

UK Office of National Statistics:
http://www.statistics.gov.uk/statbase/Product.asp?vlnk=8519
http://www.statistics.gov.uk/downloads/theme_population/NPP-2006/wuk065y.xls

Spain's ageing population

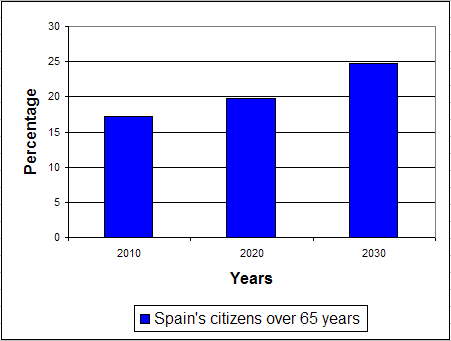
Graph of Spains's population projections

Population over 65 years

  • 2008: 17%
  • 2010: 17%
  • 2020: 20%
  • 2030: 25%
  • 2040: 31%
  • 2050: 36%


Source: EuroStat (PDF)


Notes

Spain is forecast to experience similar ageing patterns to the EU average for the next decade, but will exceed the EU average by the 2050.

[read out the data]]

Source: EUROPE IN FIGURES — Eurostat yearbook 2006-07 (Chapter 1 - Population) PDF

Japan's ageing population

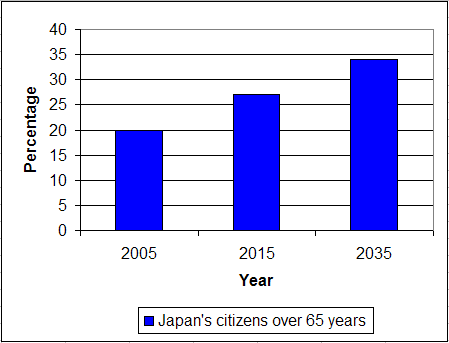
Graph of Japan's population projections

Population over 65 years

  • 1995: 15% (18.2m people)
  • 2005: 20% (25.7m people)
  • 2015: 27% (33.8m people)
  • 2035: 34% (37.2m people)
  • 2055: 41% (36.5m people)


Source: Reuters


Notes

Discuss the numbers and emphasize that in Japan it is currently 1 in 5 over 65; within 30 years it will be 1 in 3
Japan's proportion of people over 65 years is the highest in the world
, and the UN forecasts that "population of Japan is projected to remain the oldest in the world with a median age of 55 years in 2050."

At the same time, Japan's total population is expected to decline from around 127m people at present to less than 90m people by 2050.

Source:
Reuters, undated - http://www.reuters.com/news/globalcoverage/agingjapan
Reuters, 17 Sept 2007 - http://www.reuters.com/article/ousiv/idUST2888420070917
UN - http://www.un.org/esa/population/publications/wpp2006/wpp2006.htm

United States' ageing population

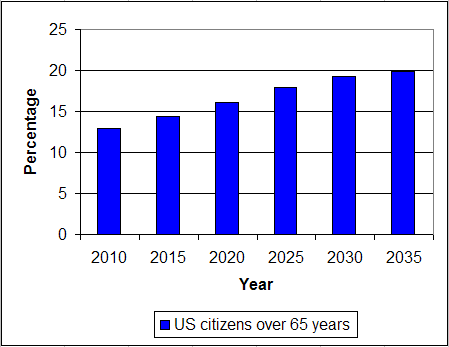
Graph of US population projections

Population over 65 years

  • 2010: 13.0%
  • 2015: 14.4%
  • 2020: 16.1%
  • 2025: 17.9%
  • 2030: 19.3%
  • 2035: 19.9%


Source: US Census


Notes

US projects are ... [read out numbers]

The United States is forecast to experience lower ageing patterns compared with the EU. For example, the US is forecast to have 16% of its population over 65 year of age in 2020, while Europe forecasts 21%.

[read out the data]

Source: US Population Projections (released 2008) - see Table 3

Australia's ageing population

Graph of Australian population projections

Population over 65 years

  • 2006: 13%
  • 2016: 16%
  • 2026: 21%
  • 2036: 24%


Source: ABS Population Projections


Notes

Australian projections are ... [read out numbers]

Australia is forecast to experience lower ageing patterns compared with the EU average. For example, Australia is forecast to only have 19% of its population over 65 year of age in 2026, while Europe forecasts 36% in 2025.

Source: ABS Australian Population Projections (2006 TO 2101) - Catalogue # 3222.0
http://www.abs.gov.au/AUSSTATS/abs@.nsf/DetailsPage/3222.02006%20to%202101?OpenDocument

Another country's ageing population

Graph of XX population projections

Population over 65 years

create a local slide if details are available

Notes

Note to presenters:
Forecasts for all EU countries are available from EUROPE IN FIGURES — Eurostat yearbook 2006-07 (Chapter 1 - Population) PDF
UN forecasts for most regions and countries are available from the UN's Population database
Local projections may be available from the national statistics organization or Government department in your country

heading (slide template)

subheading

text & bullets

Notes

Speakers notes ...

Note to presenters:
...