Warning:
This wiki has been archived and is now read-only.
Use Cases
Contents
- 1 Automated Processing of CSV (Validation)
- 2 Relational Data and Row-Formats
- 3 Publication of Statistics
- 4 Organogram Data
- 5 Publication of weather observation time-series data as input into analysis or impact assessment
- 6 Publication of Data by the UK Land Registry
- 7 A local archive of metadata for a collection of journal articles
- 8 Reliability Analysis of Police Open Data
- 9 Analyzing Scientific Spreadsheets
- 10 Peel Sessions
- 11 Visualisation of time series data with annotations
- 12 Mass Spec
- 13 FTIR Fourier Transform Infrared Spectroscopy
- 14 OpenSpending data
- 15 NetCDF data
- 16 City of Palo Alto Tree Data
- 17 Protein Data Bank File Format
- 18 XYZ Chemical File Format
- 19 Creation of consolidated global land surface temperature climate databank
- 20 Representing entitles and facts extracted from text
- 21 Displaying Locations of Care Homes on a Map
- 22 Intelligently Previewing CSV files
- 23 Making Sense of Other People's Data
- 24 Other W3C use cases and requirement docs
- 25 Analysis of use cases
- 26 Use case document outline
Automated Processing of CSV (Validation)
Contributed by: Adam Retter
The National Archives, require metadata to accompany Transfers of Records from OGDs (Other Governmental Departments) and NGO's (Non-Governmental Departments). This metadata needs to be machine processable to extract the facts about the records. Ultimately this metadata is used for 3 main purposes: 1) Integrity and Provenance, 2) Presentation and Search and 3) Legal Qualification. The technical metadata is typically machine extracted and is easier to handle, however we also collect metadata from humans, for example in the form of Transcriptions of records.
Ultimately all of this data ends up both in RDF in our Catalogue (Triple Store) and in XML in our Digital Preservation store (Massive Hierarchical Tape Library). However the organisations transferring their records to us lack either the technology or resources to provide us with metadata in RDF or XML formats. As such organisations provide us with metadata in CSV format. As much of this work has legal or financial implications, The National Archives sets requirements for the metadata fields that must be supplied and how they must be formatted. These requirements allow us to further automate the machine processing of the CSV files to achieve our Digital Preservation goals.
The CSV metadata that we receive must be set out according to our specifications, otherwise further automated processing may fail. To ensure this we QA all metadata using our CSV Validation tool. The CSV Schema that we give to the CSV Validation Tool also forms the basis of a formal contract between us and the supplying organisation. For tool and schema see https://github.com/digital-preservation/csv-validator (includes various csv files)
Relational Data and Row-Formats
Contributed by: Adam Retter
Collections of Records received from supplying organisations by The National Archives are anything but uniform. These records have many edge cases, as typically they have been created and updated over an extended period of time by several people, and each person may have had a different approach to recording the same facts. The metadata for these records is transferred to the National Archives in CSV format. There is typically a single CSV file containing all of the metadata for a set of records. When the metadata is transcriptions of the records, the transcriptions are highly variable due to what is available in the record and how the record is structured. Outcomes:
1) We often find that we need to describe related records in a single CSV file format. Using a constant and fixed column layout, each row has one of more identifiers, and rows may refer to other rows through these identifiers. Each identifier reference is kept in it's own column. For example:
id,parent,sub-item,desc
1,,,root
2,1,4,child
3,1,,other child
4,,,related to child
2) Each row in the CSV which describes a record may talk about a specific type of record. The type of the record dictates which columns should be filled out in the CSV file for that row. Effectively you have a specific row-format. We use a constant and fixed column layout, however we have a column which indicates the type of the record, and we validate that a record of that type has values for the expected columns, but that others are empty. For example:
id,type,a,b,c
1,4,x,y,
2,8,,n,o
In the above records of type '4' must have fields 'a' and 'b' completed, whereas records of type '8' must have fields 'b' and 'c' completed.
Publication of Statistics
Contributed by Jeni Tennison
The Office of National Statistics (ONS) in the UK publishes a range of tabular data, mostly in Excel format. Some examples are:
- http://www.ons.gov.uk/ons/rel/ppi2/producer-prices-indices/december-2013/rft-mm22-producer-price-indices--reference-table--december-2013.xls
- http://www.ons.gov.uk/ons/rel/cpi/consumer-price-indices/december-2013/consumer-price-inflation-reference-tables.xls
- http://www.ons.gov.uk/ons/rel/lms/labour-market-statistics/january-2014/table-a01.xls
The Excel files include multiple datasets, and include metadata about those datasets, about particular columns, the measures that are used in the cells, and about individual cells (such as notes and annotations).
It is hard for data reusers to extract data from these spreadsheets for further processing, because they are not in a regular format. ONS do not want to provide data purely as CSV because there is no way to embed the metadata that is necessary for correct interpretation of the statistics.
They would like a publication format that can capture all the information in these Excel files:
- packages many CSV files (which don't necessarily refer to each other) with metadata about those datasets
- includes a mechanism for providing annotations about individual cells within the CSV files
- incorporates links:
- within metadata (to point to more information on the ONS website)
- for column headers (to provide further information about what they mean)
- for some values (particularly geographic codes, each of which has a URL)
Organogram Data
Contributed by Jeni Tennison
The UK Government publishes information about public sector roles and salaries as two CSV files: one for senior roles and one for junior roles. See for example this data about Home Office staff.
The definition of the format for these files is created and maintained by the Cabinet Office. When the CSVs are published on the web, they need to reference this centrally defined schema (rather than, say, being packaged with a copy of schema) to make sure that they are adhering to the correct format.
These files also demonstrate cross-linking between two different CSV files. The Reporting Senior Post column in the file about junior staff cross references to the the Post Unique Reference column in the file about senior staff.
The files are converted to RDF through a customised program, because the RDF structure is much more complex than that of the CSV. For example, see:
Publication of weather observation time-series data as input into analysis or impact assessment
Contributed by Jeremy Tandy
Weather observation data collated over long time periods can be used to assess trends in climate (climate monitoring) or correlation with socio-economic and/or environmental factors. Such assessment is often used to develop an impact model that can be used to help determine future policy or business rules.
For example, an increasing occurrence of rainfall events that correlate with insurance claims against flood damage may be used as input to cost-benefit analysis of new infrastructure projects (e.g. flood defence schemes) or changes to water course management regimes (e.g. more frequent dredging). Alternatively, the insurance industry may, hypothetically, use such information to assess flood risk in relation to setting insurance premiums.
The tooling available for these analyses (e.g. spread sheets and macros, R statistical analysis functions etc.) tend to drive a column- or array-oriented approach to the solution.
As a result, there is a significant demand for weather observation data to be published in a tabular form, such as CSV, for easy consumption within commonly available toolsets.
Examples datasets include:
- UKCP09 (UK Climate Projections) Daily data sets; e.g. time series of daily values (1960-2011) by grid point, downloadable in blocks covering 50 km x 50 km squares, as comma-delimited text files (1)
- Hadley Centre Central England Temperature (HadCET) dataset (2)(3)(4)
- Historic station observations (& from data.gov.uk); monthly data are available from 37 long-running historic stations, each series typically ranging from 50 to more than 100 years in length (5)
CSV format also provides a compact method of delivering long-term time-series data; e.g. 50 years of daily values equates to more than 18000 values. However, use of compression algorithms are likely to mitigate this benefit in comparison to markup or graph formats (XML, JSON).
Typically, these datasets are partitioned into multiple files to make manageable for end-users. Partitioning strategies are typically one of:
- providing a time-series of data for a given point or region (e.g. indicating variation of observed properties with time at a specific location)
- providing the set of values for observed properties at all locations within the dataset for a specific time or period
ISSUE: there is no machine-readable mechanism available to describe how the set of files are related
Also, given that a CSV file is associated with a given location, or perhaps a given time, we often see that information pertinent to _all_ weather observations in a given file is “normalised” out to appear once in the header (or some supplementary text that accompanies the CSV file). This means that the weather observation described in each row of the CSV file is a combination of the data in that row _plus_ the file-level data.
ISSUE: there is no machine-readable mechanism to associate, or attach, file-level data properties to the entity described in each row of the CSV file.
The main problem when working with data in CSV format is that the meaning associated with each column of values or the entity described within each row are, at best, described using free text. Human intervention is required to infer the meaning of columns and rows before the dataset can be combined with other data within an analysis.
Evidence suggests that analysts (and scientists) spend a significant proportion of their time (greater than 50%) “conditioning” data to be in the correct structure or format for their analyses - at least some of which is attributable to the lack of machine readable semantics in their data.
ISSUE: there are no formal, machine-readable semantics associated with the data.
The semantics associated with weather observations are reasonably complex. The utility of a weather observation dataset is entirely dependent on the context provided for each observation. For example, the observed value “-1°C” only makes sense when the location (Exeter International Airport), date-time (19 January 2014, 09:00Z) and physical property (air temperature) are also provided. The more sensitive one is to the quality of a given weather observation (e.g. a scientist evaluating long-term climate change), the more metadata one will need to evaluate fitness for purpose: what procedure or sensor was used, were there any specific environmental factors in effect, has the data been quality assured and if so, by whom etc.
The meteorological community have been collaborating through standards organisations such as the World Meteorological Organisation (WMO) <http://www.wmo.int>, the Open Geospatial Consortium (OGC) <http://www.opengeospatial.org> and ISO Technical Committee for Geographic Information (ISO/TC 211) <http://www.isotc211.org> to develop common approaches to expressing the contextual metadata for observation events; "Observations and measurements” (O&M2) (6)(7).
O&M2 has been incorporated into legislation (e.g. European INSPIRE Directive 2007/2/EC) and used as input to the W3C Semantic Sensor Network Incubator Group. Furthermore, the (draft) rules from ISO/DIS 19150-2 "Geographic information -- Ontology -- Part 2: Rules for developing ontologies in the Web Ontology Language (OWL)” mean that the abstract specifications from ISO/TC 211 are now being converted into OWL ontologies for use within Linked Data and the semantic web.
As a result, the formal, machine readable semantics relevant to the CSV-encoded datasets are often predefined in international standards, legislation or best practice (8). Typically, these ontologies are complex - wherein the data record for an observation event is more akin to a graph (with nesting and substructure) as opposed to a “flat” row from a table.
ISSUE: the rich semantics need to adequately describe weather observation data cannot be expressed as a “flat” record.
(1) these datasets are freely available, but require registration
(2) The CET dataset is the longest instrumental record of temperature in the world. The mean, minimum and maximum datasets are updated monthly, with data for a month usually available by the 3rd of the next month. A provisional CET value for the current month is calculated on a daily basis. The mean daily data series begins in 1772 and the mean monthly data in 1659. Mean maximum and minimum daily and monthly data are also available, beginning in 1878.
(3) HadCET can be downloaded here
(4) Example HadCET data format
Column 1: year
Column 2: day
Columns 3-14: daily CET values expressed in tenths of a degree. There are 12 columns; one for each of the 12 months.
 1772    1   32  -15   18   25   87  128  187  177  105  111   78  112
 1772    2   20    7   28   38   77  138  154  158  143  150   85   62
 1772    3   27   15   36   33   84  170  139  153  113  124   83   60
 1772    4   27  -25   61   58   96   90  151  160  173  114   60   47
 1772    5   15   -5   68   69  133  146  179  170  173  116   83   50
 1772    6   22  -45   51   77  113  105  175  198  160  134  134   42
(5) Example for “Chivenor”, south west England
Chivenor
Location 2496E 1344N 6m amsl
Estimated data is marked with a * after the value.
Missing data (more than 2 days missing in month) is marked by  ---.
Sunshine data taken from an automatic Kipp & Zonen sensor marked with a #, otherwise sunshine data taken from a Campbell Stokes recorder.
   yyyy  mm   tmax    tmin      af    rain     sun
              degC    degC    days      mm   hours
   1951   1    7.9     3.9    ---    106.2    48.2
   1951   2    8.3     2.8    ---     96.3   105.2
   1951   3    8.6     3.5    ---    102.1   104.9
   1951   4   11.4     4.2    ---     94.2   225.1
   1951   5   14.1     7.0    ---     59.9   198.7
   1951   6   18.6    10.7    ---     21.8   255.3
   1951   7   20.2    12.2    ---     39.1   261.5
     … etc. …
(6) OGC Abstract Specification Topic 20 - Observations and measurements
(7) ISO 19156:2011 Geographic information - Observations and measurements
(8) Examples include: Semantic Sensor Network Ontology, O&M2, QUDT
Publication of Data by the UK Land Registry
Contributed by Andy Seaborne
The UK Land Registry keeps the evidence of ownership of land and property in England and Wales. One of the data products they produce is the Price paid data recording every property transaction. Data from 1995 to the present day is online.
This is published as data where the RDF database records the current correct data since 1995.
Previously, and still in parallel for existing data consumers, the Land Registry published CSV files. Each CSV file (several variations) represents one month of data but, unlike the linked data, each month is a set of differences from the previous month. While most new records are additions, marked 'A' in the final column, there are also corrections, 'C' and deletions 'D'.
The same monthly workflow also drives the production of changes to be applied to the linked data database. The CSV produced are
There are dumps for the whole dataset (without change processing unlike the linked data database - it is the amalgamation of all monthly differences).
Some features:
- Each row has a unique identifier .
- The data is a diff, and not a particular view of the data.
- There is codes for classification (e.g. new build property, or house style, flat/semi-detached/detached). The codes are outside the published files.
- Some information is authoritative and some is reported (i.e. not authoritative or verified)
A local archive of metadata for a collection of journal articles
Contributed by Alf Eaton
Aim: a local database of all the articles published in PLOS ONE.
Method: query the PLOS API, which is a Solr index of journal articles (Solr has a CSV output format for search results, which is more concise than the JSON output format): [1]
id,publication_date,title_display,author
10.1371/journal.pone.0087584,2014-02-14T00:00:00Z,Healthcare Worker Perceived Barriers to Early Initiation of Antiretroviral and Tuberculosis Therapy among Tanzanian Inpatients,"Bahati M K Wajanga,Robert N Peck,Samuel Kalluvya,Daniel W Fitzgerald,Luke R Smart,Jennifer A Downs"
10.1371/journal.pone.0087286,2014-02-14T00:00:00Z,"Subditine, a New Monoterpenoid Indole Alkaloid from Bark of <i>Nauclea subdita</i> (Korth.) Steud. Induces Apoptosis in Human Prostate Cancer Cells","Sook Yee Liew,Chung Yeng Looi,Mohammadjavad Paydar,Foo Kit Cheah,Kok Hoong Leong,Won Fen Wong,Mohd Rais Mustafa,Marc Litaudon,Khalijah Awang"
10.1371/journal.pone.0087630,2014-02-14T00:00:00Z,Spatiotemporal Characterizations of Dengue Virus in Mainland China: Insights into the Whole Genome from 1978 to 2011,"Hao Zhang,Yanru Zhang,Rifat Hamoudi,Guiyun Yan,Xiaoguang Chen,Yuanping Zhou"
10.1371/journal.pone.0086587,2014-02-14T00:00:00Z,<i>optGpSampler</i>: An Improved Tool for Uniformly Sampling the Solution-Space of Genome-Scale Metabolic Networks,"Wout Megchelenbrink,Martijn Huynen,Elena Marchiori"
10.1371/journal.pone.0082694,2014-02-14T00:00:00Z,Prophylactic Antibiotics to Prevent Cellulitis of the Leg: Economic Analysis of the PATCH I & II Trials,"James M Mason,Kim S Thomas,Angela M Crook,Katharine A Foster,Joanne R Chalmers,Andrew J Nunn,Hywel C Williams"
As the "rows" parameter is set to "5", the first 5 rows are returned. To paginate through the collection, add "&start={offset}" (e.g. "&start=5") to the query.
It would be useful to receive, at the start of the response, an indication of the total number of results (as is present in the JSON version of the response, as OpenSearch fields).
It would also be useful to be able to continue fetching rows using the last known identifier, with "&before={id}" or "&since={id}", to avoid issues of pagination if the result set is altered while while it is being fetched.
To allow incremental updates to the local collection, it would again be useful to support "&since={id}" (or an If-Modified-Since header), to fetch all the items since the query was last update.
For archiving, it might also be desirable to break the data up into separate CSV files - one per day - that can easily be synchronised between machines and recombined when needed.
For converting to linked data, it would be useful to be able to specify the data type of each cell, and to map the column headers and values to URLs.
The author field contains multiple names separated by commas (and so the field is quoted). It would be useful if the description of the column could specify that the column can contain multiple values, and what the delimiter between them is.
Reliability Analysis of Police Open Data
Contributed by Davide Ceolin
Several Web sources expose datasets about UK crime statistics. These datasets vary in format (e.g. maps vs. CSV files), timeliness, aggregation level, etc. Before being published on the Web, these data are processed to preserve the privacy of the people involved, but again the processing policy varies from source to source.
Every month, the UK Police Home Office publishes (via data.police.uk) CSV files that report crime counts, aggregated on geographical basis (per address or police neighbourhood) and on type basis. Before publishing, data are smoothed, that is, grouped in predefined areas and assigned to the mid point of each area. Each area has to contain a minimum number of physical addresses. The goal of this procedure is to prevent the reconstruction of the identity of the people involved in the crimes.
Over time, the policies adopted for preprocessing these data have changed, but data previously published have not been recomputed. Therefore, datasets about different months present relevant differences in terms of crime types reported and geographical aggregation (e.g. initially, each geographical area for aggregation had to include at least 12 physical addresses. Later, this limit was lowered to 8).
These policies introduce a controlled error in the data for privacy reasons, but these changes in the policies imply the fact that different datasets adhere differently to the real data, i.e. they present different reliability levels. Previous work [1] provided two procedures for measuring and comparing the reliability of the datasets, but in order to automate and improve these procedures, it is crucial to understand the meaning of the columns, the relationships between columns, and how the data rows have been computed.
For instance, here is a snippet from a dataset about crime happened in Hampshire in April 2012:
Month,Force,Neighbourhood,Burglary,Robbery,Vehicle crime,Violent crime,Anti-social behaviour,Other crime
2011-04,Hampshire Constabulary,2LE11,2,0,1,6,14,6
2011-04,Hampshire Constabulary,2LE10,1,0,2,4,15,6
2011-04,Hampshire Constabulary,2LE12,3,0,0,4,25,21
and that dataset reports 248 entries, while in October 2012, the crime types we can see are increased to 11:
Month,Force,Neighbourhood,Burglary,Robbery,Vehicle crime,Violent crime,ASB,CDA,Shoplifting,Other theft,Drugs,PDW,Other crime
2012-10,Hampshire Constabulary,2LE11,1,0,1,2,8,0,0,1,1,0,1
2012-10,Hampshire Constabulary,1SY01,9,1,12,8,87,17,12,14,13,7,4
2012-10,Hampshire Constabulary,1SY02,11,0,11,20,144,39,2,12,9,8,5
- ASB = Anti-social behaviour
- PDW = Public Disorder and Weapons
- CDA = Criminal damage and arson
This dataset reports 232 entries.
So, the following requirements emerge from the column differences:
REQ: automated recognition of data type and format REQ: automated recognition of data semantics
In fact, the first requirement refers to the fact that, in order to properly handle the columns, it is crucial to understand the type of the data therein contained. Given the context, knowing this information would reveal an important part of the column semantics (e.g. in the case of a date). Second, it is important to understand the precise semantics of each column. This is relevant for two reasons. First, to identify relations between columns (e.g. some crime types are siblings, while other are less semantically related). Second, to identify semantic relations between columns in heterogeneous datasets (e.g. a column in one dataset may correspond to the sum of two or more columns in others).
Lastly, a requirement emerges also from the row differences:
REQ: CSV file provenance tracking
Datasets with different row numbers are the result of different smoothing procedures. Therefore, it would be important to trace and access their provenance, in order to facilitate their comparison.
References
- Davide Ceolin, Luc Moreau, Kieron O'Hara, Guus Schreiber, Alistair Sackley, Wan Fokkink, Willem Robert Van Hage, Nigel Shadbolt, "Reliability Analyses of Open Government Data". URSW2013. http://ceur-ws.org/Vol-1073/pospaper2.pdf
Analyzing Scientific Spreadsheets
Contributed by Alf Eaton, Davide Ceolin, Martine de Vos
A paper published in Nature Immunology in December 2012 compared changes in expression of a range of genes in response to treatment with two different cytokines [1]. The results were published in the paper as graphic figures, and the raw data was presented in the form of two supplementary spreadsheets, as Excel files [2].
There is just about enough information in the article and the Excel files to be able to work out what the data represents, but it would be difficult to write a parser to extract the information, for the following reasons:
- Multiple heading rows: The table contains several columns of data that are measurements of gene expression in cells after treatment with two concentrations of two cytokines, measured after two periods of time, presented as both actual values and fold change. This can be represented in a table, but needs 3 levels of headings and several merged cells.
- Gene identifiers without mapping to URLs: The first column contains a GenBank identifier for each gene, with the column name "gene_name". It would be useful to be able to describe the type of data in this column, either using a URL prefix ("http://www.ncbi.nlm.nih.gov/nuccore/"), or a standard name ("genbank"), so that the parser can convert each cell to a URL (e.g. <http://www.ncbi.nlm.nih.gov/nuccore/NM_008638>) to uniquely identify each gene.
- Gene symbols without mapping to URLs: The second column contains the standard symbol for each gene, labelled as "symbol". These appear to be HUGO gene nomenclature symbols, but as there's no mapping it's hard to be sure which namespace these symbols are from.
- Undocumented column: As this spreadsheet was published as supplemental data for a journal article, there is little description of what the columns represent, even as text. There is a column labelled as "Cont", which has no description anywhere, but is presumably the background level of expression for each gene.
- Headers vs values: The first row is the title of the table; the second to fourth rows are the table headers, and the first two columns are also headers. It would be useful to be able to describe this in a way that a parser could understand. Cell borders are also used to communicate information, though this table would still be understandable without them.
- Units and formulae: Half of the cells represent measurements, but the details of what those measurements are can only be found in the article text. The other half of the cells represent the change in expression over the background level. It is difficult to tell the difference without annotation that describes the relationship between the cells (or understanding of the nested headings). In this particular spreadsheet, only the values are published, and not the formulae that were used to calculate the derived values. The units of each cell are "expression levels relative to the expression level of a constant gene, Rpl7", described in the text of the methods section of the full article.
- Description of treatments only in column headings: The heading rows contain details of the treatment that each cell received, e.g. "4 hour, IL2_1nM". It would be useful to be able to make this machine readable (i.e. to represent treatment with 1nM IL-2 for 4 hours).
- Description of the experiment: All the details of the experiment (which cells were used, how they were treated, when they were measured) are described in the methods section of the article. To be able to compare data between multiple experiments, a parser would also need to be able to understand all these parameters that may have affected the outcome of the experiment.
References
- http://www.nature.com/ni/journal/v13/n12/full/ni.2449.html#supplementary-information
- http://www.nature.com/ni/journal/v13/n12/extref/ni.2449-S3.xls
Peel Sessions
Contributed by Alf Eaton
The BBC has published metadata for each of the Peel Sessions recordings/broadcasts. For re-use in the future, it would be useful to be able to store the data as a CSV table(s). Alternatively, line-oriented JSON could be a reasonable storage solution for this metadata.
Data description
- Each session has zero or one "recorded" date, and zero or one "transmitted" date (missing if not known).
- Each session has at least one artist/group.
- Each session has zero or one producer.
- Each session has multiple tracks.
- Each artist/group has zero or more members.
- Each group members has zero or more instruments.
An example Peel Session as a JSON object
Data as relational data
Separate tables for session, session_tracks, group, group_members, group_member, group_member_instruments.
Data as CSV
(comma-separated multiple values, nested values in brackets)
recorded,transmitted,artist/group,producer,tracks,lineup
1968-06-05T00:00:00Z,1968-12-05T00:00:00Z,Captain Beefheart & His Magic Band,Bernie Andrews,"Safe As Milk,Beatle Bones 'N' Smoke'N' Stones,Kandy Korn,You Gotta Trust Us","Captain Beefheart (Vocals),John French (Drums),Alex St. Clair (Lead Guitar),Jerry Handley (Bass),Jeff Cotton (Guitar)""
Problems with the CSV format
- Can't specify identifiers for artist/group or people.
- Can't specify data types.
- Can't specify that there are multiple values in a cell - should be parsed as independent CSV strings?
- Can't specify nested data (e.g. instruments).
Visualisation of time series data with annotations
Contributed by Alf Eaton
(related to "Publication of weather observation time-series data", above)
Time series data usually has at least two columns: the first is the date/time, and the subsequent columns are the values for that point in time.
There isn't an obvious way to add annotations to particular measurements (for example, to add a note about why a sudden spike might have appeared in the data), so Google Spreadsheets uses an "annotations" column alongside the data column as a workaround.
As there is a draft proposal of URI Identifiers for CSV files, it may be worth using the Open Annotation ontology and data model to attach annotations to certain rows, columns or cells of tabular data.
Mass Spec
Contributed by Matthew Thomas
Mass Spectrometric Imaging (MSI) allows the generation of 2D ion density maps that help visualize molecules present in sections of tissues and cells. The combination of spatial resolution and mass resolution results in very large and complex data sets. The following is generated using the software Decon Tools, a tool to de-isotope MS spectra and to detect features from MS data using isotopic signatures of expected compounds, available freely at omins.pnnl.gov. The raw files generated by the mass spec instrument are read in and the processed output files are saved as csv files for each line.
Below are (3 of 316 CSV rows) for a single line on a sample. It gives the mass-to-charge ranges, peak values, acquisition times and total ion current.
scan_num,scan_time,type,bpi,bpi_mz,tic,num_peaks,num_deisotoped,info 1,0,1,4.45E+07,576.27308,1.06E+09,132,0,FTMS + p NSI Full ms [100.00-2000.00] 2,0.075,1,1.26E+08,576.27306,2.32E+09,86,0,FTMS + p NSI Full ms [100.00-2000.00] 3,0.1475,1,9.53E+07,576.27328,1.66E+09,102,0,FTMS + p NSI Full ms [100.00-2000.00]
FTIR Fourier Transform Infrared Spectroscopy
Contributed by Matthew Thomas
The files from the instrument are baseline corrected, normalized and saved as csv files automatically. Column 1 represents the wavelength # or range and the represent different formations like bound eps (extracellular polymeric substance), lose eps, shewanella etc. Below are (5 of 3161 rows) is a example:
,wt beps,wt laeps,so16533 beps,so167333 laeps,so31 beps,so313375 lAPS,so3176345 bEPS,so313376 laEPS,so3193331 bEPS,so3191444 laeps,so3195553beps,so31933333 laeps 1999.82,-0.0681585,-0.04114415,-0.001671781,0.000589855,0.027188073,0.018877371,-0.066532177,-0.016899697,-0.077690018,0.001594551,-0.086573831,-0.08155035 1998.855,-0.0678255,-0.0409804,-0.001622611,0.000552989,0.027188073,0.01890847,-0.066132737,-0.016857071,-0.077346835,0.001733207,-0.086115107,-0.081042424 1997.89,-0.067603,-0.0410459,-0.001647196,0.000423958,0.027238845,0.018955119,-0.065904461,-0.016750515,-0.077101756,0.001733207,-0.085656382,-0.080590934 1996.925,-0.0673255,-0.04114415,-0.001647196,0.000258061,0.027289616,0.018970669,-0.065790412,-0.01664396,-0.076856677,0.001629215,-0.085281062,-0.080365189
OpenSpending data
Contributed by Stasinos Konstantopoulos
Raw datasets for OpenSpending.org visualizations are on http://datahub.io/organization/openspending and comprise CSV, xls, and similar formats relevant to the WG. Similar datasets are also available at http://datahub.io/organization/budgit
Some interesting cases:
- In http://datahub.io/dataset/ugandabudget there are four columns related to the amount: "amount" (Ugandan Shillings implied) and "amount_dollars" (USD implied) must be there, but donation rows also have "amount_donor" (the amount in the donor's original currency) and "donorcurrency" (the donor's currency name). The latter two are "0" if this is not a donation row. I would expect these four columns to be interpreted as a blank node with multiple properties, or some other RDF way of grouping the three equivalent amounts and the currency they're in.
- There are whole collections of datasets where a single currency is implied for all amounts given. See, for example, how all datasets are http://datahub.io/dataset/si-budgets implicitly give amounts in Euros. It would be interesting to be able to specify that in all currently listed datasets under that URL, as well as any added in the future, from 2007 onwards give amounts in EUR.
NetCDF data
Contributed by Stasinos Konstantopoulos
NetCDF is a set of software libraries and self-describing, machine-independent data formats that support the creation, access, and sharing of array-oriented scientific data [1]. NetCDF files contain tabular data, prepended by a header that goes beyond simple column names to document the types and ranges of the data. It would be interesting to be able to axiomatize NetCDF files as a whole, rather than having humans read and headers and assign semantics.
[1] Copy-pasted from http://www.unidata.ucar.edu/software/netcdf/
City of Palo Alto Tree Data
Contributed by Eric Stephan on behalf of the Data on the Web Best Practices (DWBP) Working Group
In a DWBP use case discussion with Jonathan Reichental City of Palo Alto CIO, he brought to the working groups attention a Tree Inventory [1] maintained by the city in a spreadsheet form.
[1] Map
[2] Spreadsheet
Protein Data Bank File Format
Contributed by Eric Stephan
The Protein Data Bank (pdb) file format is a text file describing the three dimensional structures of molecules held in the Protein Data Bank. The pdb format accordingly provides for description and annotation of protein and nucleic acid structures including atomic coordinates, observed sidechain rotamers, secondary structure assignments, as well as atomic connectivity.
[1] Copied from WikiPedia Source
[2] Sample PDB File
XYZ Chemical File Format
Contributed by Eric Stephan
The XYZ file format is a chemical file format. There is no formal standard and several variations exist, but a typical XYZ format specifies the molecule geometry by giving the number of atoms with Cartesian coordinates that will be read on the first line, a comment on the second, and the lines of atomic coordinates in the following lines [1]:
5
methane molecule (in Ångströms)
C 0.000000 0.000000 0.000000
H 0.000000 0.000000 1.089000
H 1.026719 0.000000 -0.363000
H -0.513360 -0.889165 -0.363000
H -0.513360 0.889165 -0.363000
[1] copied from wikipedia source
Creation of consolidated global land surface temperature climate databank
Contributed by Jeremy Tandy
Climate change and global warming have become one of the most pressing environmental concerns in society today. Crucial to predicting future change is an understanding of how the world’s historical climate, with long duration instrumental records of climate being central to that goal. Whilst there is an abundance of data recording the climate at locations the world over, the scrutiny under which climate science is put means that much of this data remains unused leading to a paucity of data in some regions with which to verify our understanding of climate change.
The International Surface Temperature Initiative seeks to create a consolidated global land surface temperatures databank as an open and freely available resource to climate scientists.
To achieve this goal, climate datasets, known as “decks”, are gathered from participating organisations and merged into a combined dataset using a scientifically peer reviewed method which assesses the data records for inclusion against a variety of criteria.
Given the need for openness and transparency in creating the databank, it is essential that the provenance of the source data is clear. Original source data, particularly for records captured prior to the mid-twentieth century, may be in hard-copy form. In order to incorporate the widest possible scope of source data, the International Surface Temperature Initiative is supported by data rescue activities to digitise hard copy records.
The data is, where possible, published in the following four stages:
- Stage 0: raw digital image of hard copy records or information as to hard copy location
- Stage 1: data in native format provided
- Stage 2: data converted into a common format and with provenance and version control information appended
- Stage 3: merged collation of stage 2 data within a single consolidated dataset
The Stage 1 data is typically provided in tabular form - the most common variant is white-space delimited ASCII files. Each data deck comprises multiple files which are packaged as a compressed tar ball (.tar.gz). Included within the compressed tar ball package, and provided alongside, is a read-me file providing unstructured supplementary information. Summary information is often embedded at the top of each file.
For example, see the Ugandan Stage 1 data deck and associated readme file.
The Ugandan Stage 1 data deck appears to be comprised of two discrete datasets, each partitioned into a sub-directory within the tar ball: uganda-raw and uganda-bestguess. Each sub-directory includes a Microsoft Word document providing supplementary information about the provenance of the dataset; of particular note is that uganda-raw is collated from 9 source datasets whilst uganda-bestguess provides what is considered by the data publisher to be the best set of values with duplicate values discarded.
REQ: annotation and supplementary information
Dataset uganda-raw is split into 96 discrete files, each providing maximum, minimum or mean monthly air temperature for one of the 32 weather observation stations (sites) included in the data set. Similarly, dataset uganda-bestguess is partitioned into discrete files; this case just 3 files each of which provide maximum, minimum or mean monthly air temperature data for all sites. The mapping from data file to data sub-set is described in the Microsoft Word document.
REQ: how does the data sub-set represented in a single CSV file fit within the logical dataset
A snippet of the data indicating maximum monthly temperature for Entebbe, Uganda, from uganda-raw is provided below. File = 637050_ENTEBBE_tmx.txt
637050  ENTEBBE
5
ENTEBBE BEA     0.05    32.45   3761F
ENTEBBE GHCNv3G 0.05    32.45   1155M
ENTEBBE ColArchive      0.05    32.45   1155M
ENTEBBE GSOD    0.05    32.45   1155M
ENTEBBE NCARds512       0.05    32.755  1155M

Tmax
{snip}
1935.04	27.83	27.80	27.80	-999.00	-999.00
1935.12	25.72	25.70	25.70	-999.00	-999.00
1935.21	26.44	26.40	26.40	-999.00	-999.00
1935.29	25.72	25.70	25.70	-999.00	-999.00
1935.37	24.61	24.60	24.60	-999.00	-999.00
1935.46	24.33	24.30	24.30	-999.00	-999.00
1935.54	24.89	24.90	24.90	-999.00	-999.00
{snip}
The key characteristics are:
- white space delimited; this is not strictly a CSV file
- summary information pertinent to the “data rows” is included at the beginning of the data file
- row, column and cell value interpretation is informed by accompanying Microsoft Word document; human intervention is required to unambiguously determine semantics, e.g. the meaning of each column, the unit of measurement
- the observed property is defined as “Tmax”; there is no reference to an authoritative definition describing that property
- there is no header line providing column names
- the year & month (column 1) is expressed as a decimal value; e.g. 1901.04 – equivalent to January, 1901
- multiple temperature values (“replicates”) are provided for each row; one from each of the sources defined in the header, e.g.
BEA(British East Africa),GHCNv3G,ColArchive,GSODandNCARds512 - the provenance of specific cell values cannot be asserted; for example, data values for 1935 observed at Entebbe are digitised from digital images published in PDF
A snippet of the data indicating maximum monthly temperature for all stations in Uganda from uganda-bestguess is provided below (truncated to 9 columns). File = ug_tmx_jrc_bg_v1.0.txt
	ARUA	BOMBO	BUKALASA	BUTIABA	DWOLI	ENTEBBE AIR	FT PORTAL	GONDOKORO	[…]
{snip}
1935.04	-99.00	-99.00	-99.00	-99.00	-99.00	27.83	-99.00	-99.00	[…]
1935.12	-99.00	-99.00	-99.00	-99.00	-99.00	25.72	-99.00	-99.00	[…]
1935.21	-99.00	-99.00	-99.00	-99.00	-99.00	26.44	-99.00	-99.00	[…]
1935.29	-99.00	-99.00	-99.00	-99.00	-99.00	25.72	-99.00	-99.00	[…]
1935.37	-99.00	-99.00	-99.00	-99.00	-99.00	24.61	-99.00	-99.00	[…]
1935.46	-99.00	-99.00	-99.00	-99.00	-99.00	24.33	-99.00	-99.00	[…]
1935.54	-99.00	-99.00	-99.00	-99.00	-99.00	24.89	-99.00	-99.00	[…]
{snip}
Many of the characteristics concerning the “raw” file are exhibited here too. Additionally, we see that:
- the delimiter is now tab (
U+0009) - metadata is entirely missing from this file, requiring human intervention to combine the filename token (
tmx) with supplementary information in the accompanying Microsoft Word document to determine the semantics
ISSUE: do we support delimiters other than comma, missing (or non-unique) column names etc. … or assume that some trivial pre-processor is required to fix up the text?
At present, the global surface temperature databank comprises 25 Stage 1 data decks for monthly temperature observations. These are provided by numerous organisations in heterogeneous forms. In order to merge these data decks into a single combined dataset, each data deck has to be converted into a standard form. Columns consist of: station name, latitude, longitude, altitude, date, maximum monthly temperature, minimum monthly temperature, mean monthly temperature plus additional provenance information.
An example Stage 2 data file is given for Entebbe, Uganda, below. File = uganda_000000000005_monthly_stage2
{snip}
ENTEBBE                            0.0500    32.4500  1146.35 193501XX  2783  1711  2247 301/109/101/104/999/999/999/000/000/000/102
ENTEBBE                            0.0500    32.4500  1146.35 193502XX  2572  1772  2172 301/109/101/104/999/999/999/000/000/000/102
ENTEBBE                            0.0500    32.4500  1146.35 193503XX  2644  1889  2267 301/109/101/104/999/999/999/000/000/000/102
ENTEBBE                            0.0500    32.4500  1146.35 193504XX  2572  1817  2194 301/109/101/104/999/999/999/000/000/000/102
ENTEBBE                            0.0500    32.4500  1146.35 193505XX  2461  1722  2092 301/109/101/104/999/999/999/000/000/000/102
ENTEBBE                            0.0500    32.4500  1146.35 193506XX  2433  1706  2069 301/109/101/104/999/999/999/000/000/000/102
ENTEBBE                            0.0500    32.4500  1146.35 193507XX  2489  1628  2058 301/109/101/104/999/999/999/000/000/000/102
{snip}
Because of the heterogeneity of the Stage 1 data decks, bespoke data processing programs were required for each data deck consuming valuable effort and resource in simple data pre-processing. If the semantics, structure and other supplementary metadata pertinent to the Stage 1 data decks had been machine readable, then this data homogenisation stage could have been avoided altogether. Data provenance is crucial to this initiative, therefore it would be beneficial to be able to associate the supplementary metadata without needing to edit the original data files.
REQ: provide (hyper)links to externally managed definitions
REQ: automated recognition syntactic type for data values; e.g. date, number etc.
REQ: automated recognition of semantics
REQ: automated recognition of “missing value” token
REQ: supplementary metadata SHOULD be associated without needing to modify the original CSV file
NOTE: To express semantics in a machine readable form, RDF seems the appropriate choice. Furthermore, best practice indicates that one should adopt common and widely adopted patterns (e.g. RDF vocabularies, OWL ontologies) when publishing data to enable a wide audience to consume and understand the data. Existing (de facto) standard patterns may add complexity when defining the semantics associated with a particular row such that a single RDF predicate is insufficient. For example, to express a quantity value using QUDT we use an instance of qudt:QuantityValue to relate the numerical value with the quantity kind (e.g. air temperature) and unit of measurement (e.g. Celsius). Thus the semantics needed for a column containing temperature values might be: qudt:value/qudt:numericValue – more akin to a LDPath. Furthermore, use of OWL axioms when defining a sub-property of qudt:value would allow the quantity type and unit of measurement to be inferred, with the column semantics then being specified as ex:temperature_Cel/qudt:numericValue.
The data pre-processing tools created to parse each Stage 1 data deck into the standard Stage 2 format and the merge process to create the consolidated Stage 3 data set were written using the software most familiar to the participating scientists: Fortran 95. The merge software source code is available online. It is worth noting that this sector of the scientific community commonly uses IDL and is gradually adopting Python as the default software language choice.
The resulting merged dataset is published in several formats – including tabular text. The GHCN-format merged dataset comprises of several files: merged data and withheld data (e.g. those data that did not meet the merge criteria) each with an associated “inventory” file.
A snippet of the inventory for merged data is provided below; each row describing one of the 31,427 sites in the dataset. File = recommended-ghcn_format.monthly.stage3.v1.0.0-beta4.20130614.inv
{snip}
REC41011874   0.0500  32.4500 1155.0 ENTEBBE_AIRPO
{snip}
The columns are: station identifier, latitude, longitude, altitude (m) and station name. The data is fixed format rather than delimited.
Similarly, a snippet of the merged data itself is provided. File = recommended-ghcn_format.monthly.stage3.v1.0.0-beta4.20130614.dat
{snip}
REC410118741935TAVG 2245    2170    2265    2195    2090    2070    2059    2080    2145    2190    2225    2165
REC410118741935TMAX 2780    2570    2640    2570    2460    2430    2490    2520    2620    2630    2660    2590
REC410118741935TMIN 1710    1770    1890    1820    1720    1710    1629    1640    1670    1750    1790    1740
{snip}
The columns are: station identifier, year, quantity kind and the quantity values for months January to December in that year. Again, the data is fixed format rather than delimited.
Here we see the station identifier REC41011874 being used as a foreign key to refer to the observing station details; in this case Entebbe Airport. Once again, there is no metadata provided within the file to describe how to interpret each of the data values.
REQ: to interpret data in a given row of a CSV file, need to be able to refer to information provided in supplementary CSV files; e.g. using a foreign key type reference.
As an aside, it is worth noting that, at 422.6 MB in size, the merged data file is fairly unmanageable in size!
Representing entitles and facts extracted from text
Contributed by Tim Finin
The US National Institute of Standards and Technology (NIST) has run various conferences on extracting information from text centered around challenge problems. Participants submit the output of their systems on an evaluation dataset to NIST for scoring, typically in the form of tab-separated format.
The 2013 NIST Cold Start Knowledge Base Population Task [1], for example, asks participants to extract facts from text and to represent these as triples along with associated metadata that include provenance and certainty values. A line in the submission format consists of a triple (subj pred obj) and, for some predicates, provenance information. Provenance includes a document ID and, depending on the predicate, one or three pairs of string offsets within the document. For predicates that are relations, an optional second set of provenance values can be provided. Each line can also have a optional float as a final column to represent a certainty measure.
The following four lines show examples of possible triples of varying length. D00124 is the ID of a document and the strings like 283-286 refer to strings in a document using the offsets of the first and last characters. The final float on some lines is the optional certainty value.
  :e4 type         PER
  :e4 mention      "Bart"  D00124 283-286
  :e4 mention      "JoJo"  D00124 145-149 0.9
  :e4 per:siblings :e7     D00124 283-286 173-179 274-281
  :e4 per:age      "10"    D00124 180-181 173-179 182-191 0.9
  :e4 per:parent   :e9     D00124 180-181 381-380 399-406 D00101 220-225 230-233 201-210
The submission format does not require that each line have the same number of columns. The expected provenance information for a triple depends on the predicate. For example, for type typically has no provenance, mention has a document ID and offset pair and domain predicates like per:age have one or two provenance records each of which has a document ID and three offset pairs.
[1] http://www.nist.gov/tac/2013/KBP/ColdStart/guidelines/KBP2013_ColdStartTaskDescription_1.1.pdf
Displaying Locations of Care Homes on a Map
Contributed by Jeni Tennison
NHS Choices makes available a number of (what it calls) CSV files for different aspects of NHS data on its website at http://www.nhs.uk/aboutnhschoices/contactus/pages/freedom-of-information.aspx
One of the files contains information about the locations of care homes. The file has two interesting syntactic features:
- the field separator is the not sign (
¬,\u00AC) rather than a comma - no fields are wrapped in double quotes; some fields contain (unescaped) double quotes
I want to be able to embed a map of these locations easily into my web page using a web component, such that I can use markup like:
<map src="http://media.nhschoices.nhs.uk/data/foi/SCL.csv" latcol="Latitude" longcol="Longitude">
and see a map similar to that shown at https://github.com/JeniT/nhs-choices/blob/master/SCP.geojson, without converting the CSV file into GeoJSON.
To make the web component easy to define, there should be a native API on to the data in the CSV file within the browser.
Intelligently Previewing CSV files
Contributed by Jeni Tennison
Many data repositories, such as data.gov.uk and GOV.UK, provide a mechanism for previewing CSV datasets. But these previews are currently limited in their ability to provide intelligent displays and sorting because it's not possible for the preview code to know what types the different values are.
As an example, see http://data.gov.uk/dataset/financial-transactions-data-royal-wolverhampton-hospitals-nhs-trust/resource/e85b1d22-948d-461f-9a29-7b43dee0fc03. Note that the underlying data begins with:
"Expenditure over £25,000- Payment made in January 2014",,,,,,,,
,,,,,,,,
Department Family,Entity,Date,Expense Type,Expense Area,Supplier,Transaction Number,Amount in Sterling,
Department of Health,The Royal Wolverhampton Hospitals NHS Trust RL4,31/01/2014,Capital Project,Capital,STRYKER UK LTD,0001337928,31896.06,
Department of Health,The Royal Wolverhampton Hospitals NHS Trust RL4,17/01/2014,SERVICE AGREEMENTS,Pathology,ABBOTT LABORATORIES LTD,0001335058,77775.13,
...
The header line here comes below an empty row, and there is metadata about the table in the row above the empty row. The preview code manages to identify the headers from the CSV, and displays the metadata as the value in the first cell of the first row.
It would be good if the preview could recognise that the Date column contains a date and that the Amount in Sterling column contains a number, so that it could offer options to filter/sort these by date/numerically.
Making Sense of Other People's Data
Contributed by Steve Peters via Phil Archer with input from Ian Makgill
spendnetwork.com harvests spending data from multiple UK local and central government CSV files. It adds new metadata and annotations to the data and cross-links suppliers to OpenCorporates and, elsewhere, is beginning to map transaction types to different categories of spending. For example, East Sussex County Council publishes its spending data as Excel spreadsheets.
Transparency Q2 - 01.07.11 to 30.09.11 as at 28.10.11,,,,,
Name,Payment category,Amount,Department,Document no.,Post code
…
MARTELLO TAXIS,Education HTS Transport,£620,"Economy, Transport & Environment",7000785623,BN25
MARTELLO TAXIS,Education HTS Transport,"£1,425","Economy, Transport & Environment",7000785624,BN25
MCL TRANSPORT CONSULTANTS LTD,Passenger Services,"£7,134","Economy, Transport & Environment",4500528162,BN25
MCL TRANSPORT CONSULTANTS LTD,Concessionary Fares Scheme,"£10,476","Economy, Transport & Environment",4500529102,BN25
…
This data is augmented by spendnetwork.com and presented in a Web page.
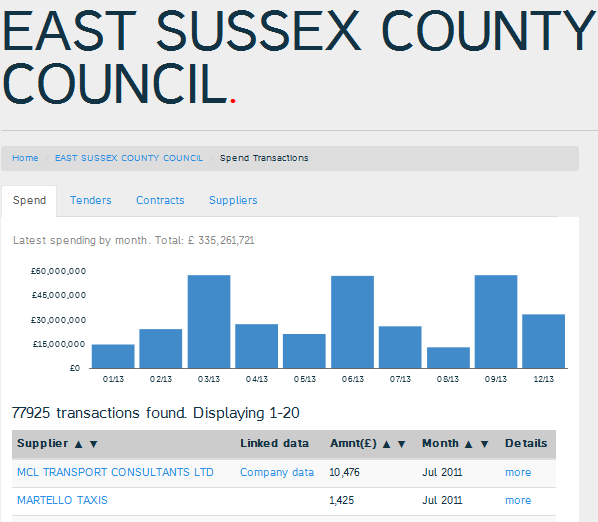
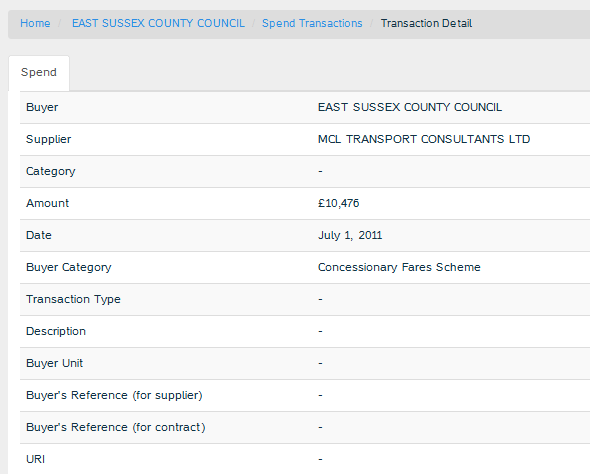
Notice the Linked Data column that links to OpenCorporates data on MCL Transport Consultants Ltd. If we follow the 'more' link we see many more fields that spendnetwork would like to include. Where data is available from the original spreadsheet it has been included.
The schema here is defined by a third party (spendnetwork.com) to make sense of the original data within their own model (only some of which is shown here, spendnetwork.com also tries to categorize transactions and more). This model exists independently of multiple source datasets and entails a mechanism for reusers to link to the original data from the metadata. Published metadata can be seen variously as feedback, advertising, enrichment or annotations. Such information could help the publisher to improve the quality of the original source, however, for the community at large it reduces the need for repetition of the work done to make sense of the data and facilitates a network effect. It may also be the case that the metadata creator is better able to put the original data into a wider context with more accuracy and commitment than the original publisher.
Another (similar) scenario is LG-Inform. This harvests government statistics from multiple sources, many in CSV format, and calculate rates, percentages & trends etc. and packages them as a set of performance metrics/measures. Again, it would be very useful for the original publisher to know, through metadata, that their source has been defined and used (potentially alongside someone else's data) in this way.
See http://standards.esd.org.uk/ and the "Metrics" tab, e.g. http://standards.esd.org.uk/?uri=metricType%2F3333
Analysis: both spendnetwork.com and LG-Inform are making sense of other people's tabular data which is time-consuming work. Making that metadata available is a potential help to the original data publisher as well as other would-be reusers of it. This suggests two requirements:
- the ability to publish metadata independently from the tabular data it describes;
- the ability to link from the metadata to the described data.
Other W3C use cases and requirement docs
A few earlier W3C use cases / requirements docs for comparison.
- SKOS - quite practical, each use case has an associated contributor, usually linking to a real world project, application or dataset from which specific data samples are taken.
- LDP - also fairly grounded in specifics (they distinguish use cases from user stories)
- DCAT - only four scenarios, but well motivated with reference to specific relevant sites and organizations.
- OWL - rather broad / vague, few links to specifics; shows risk of a weak mapping from highly general scenarios to tech solutions (in Dan's opinion...).
- Responsive images - lots of specifics including use of images
Analysis of use cases
Analysis of use cases undertaken by Jeremy Tandy