WAI R&D Symposia » Metrics Home » Proceedings » This paper.
This paper is a contribution to the Website Accessibility Metrics Symposium. It was not developed by the W3C Web Accessibility Initiative (WAI) and does not necessarily represent the consensus view of W3C staff, participants, or members.
A zero in eChecker equals a 10 in eXaminator: a comparison between two metrics by their scores
1. Problem Addressed
A zero on the scale of the eAccessibility Checker validator [1] is theoretically the same as a 10 on the scale of the eXaminator validator [2] - both mean that the page passed its full battery of tests and, in principle, corresponds to a good practice. But to what extent do the two metrics coincide in their judgments and scores? Will it be possible to correlate the two tools through the scores produced by them? Will some metrics be stricter than others? Will they tend to be more benevolent in the lower grades and more conservative in assigning higher scores?
2. Background
When, in 2005, UMIC - Knowledge Society Agency of the Ministry of Science, Technology and Higher Education put online the automatic validator eXaminator, maybe the first non-experimental validator based on a quantitative metric, the users' reaction was ambivalent: the accessibility experts reacted negatively - "accessibility can not be summed up to a grade" - but all the others who didn't have a comprehensive and authoritative knowledge of what accessibility was about, almost all of our target, perceived quite clearly the score given. A score from 0 to 10, where 10 is a good practice.
But, intrinsically, eXaminator has strong roots in manual evaluations made by a technical team of experts since 2000. Initially these manual evaluations were registered in the WCAG's checklist - one per page - but soon it was necessary to give some quantitative score to the checkpoints, to level in some way the practices observed. With the 1 to 5 stars scoring method we created the first rankings of sites in Portuguese Public Administration. It was this same methodology we brought to eXaminator but with a scale from 1 to 10. Unlike metrics as WAQM -Web Accessibility Quantitative Metric-, which seeks to achieve a failure rate for each page or UWEM accessibility metric, which seeks a failure rate for each checkpoint [4], eXaminator assigns a score to a specific occurrence in a page.
In Table 1, we have the occurrences and scores of the "Alternative Text in Images" test that is used as an example of the score methodology.
| Test i | Occurrence j | Score (Xij) |
|---|---|---|
| Alternative text in images | All the images on the page have an alt | 10 |
| There is an image on the page without alt | 3 | |
| There are several images on the page without alt | 1 |
Thus, the metric of eXaminator responds faithfully to the definition of WCAG's compliance [5] and never loses the unit of conformity: the page. This proved even truer when we tried to analyse data at other levels besides the page, like at website level or at the aggregation level of websites. We could express the data like "In x% of the pages all the images on the page have an alt" [see figure 1].
Another curious aspect to notice is that by using the metric of eXaminator, often the results are not the most expected ones. The following is an assumption made by the W3C on background information of this symposium:
"(...) For example, is a web page with two images with faulty text alternatives out of ten more accessible than another page with only one image with a faulty text alternative out of five? "
The metric of eXaminator response to this type of occurrence isn't conventional: the page with only one faulty image with text alternative would be considered a more positive practice (Xij = 3) than the one that has two images without alternative text (Xij = 1). For a designer/developer, which would be the page that would require less effort to achieve compliance? The answer is obvious: the page that has only one image to caption, regardless of the number of images that the page may have.
Our analysis [6] [7] shows that the metrics that count failure rates of checkpoints have systematically more positive results than those that respect the concept of WCAG's compliance [see figure 1].
Figure 1: WCAG conformity - the example of alt in
images. What is more correct?
(Results from the same sample - study [6])
![Two pie graphics: [eXaminator] on 20% of pages, all images have an alt; [eChecker] 38% of images have an alt.](conformance.png)
The aggregation results by occurrences was also tested in the study [8] presented in 2005 in the UK's Presidency of EU. They also used the page like unit of WCAG's conformity. It was then possible in the study [6] to do some comparative analysis by HTML elements of the UK study and the data collected by eXaminator in Portuguese Municipalities:
"By comparing some of its metrics collected in the present study we found that the nature of faults found and its extension are similar. The failure of alternative text in images is slightly more severe in Portuguese municipalities than that detected in the public services of Member States of the EU: 80% vs 64%; the use of alt in the areas of image maps is slightly better: 40% vs 50%; pages without headings is much worse in Portuguese municipalities: 74% vs 28%; HTML errors: 90% vs 100% and equal levels of depricated code in the order of 95%."
Apart from the subjective scores (Xij) assigned, the final score of eXaminator to each test is still weighted (Wj) in accordance to the priority level of WCAG's checkpoint to which the test belongs.
| Tests related to... | Wj |
|---|---|
| checkpoints of priority 1 | 10 |
| checkpoints of priority 2 | 8 |
| checkpoints of priority 3 | 6 |
In the metric of eXaminator, all the 61 tests are based on the following formula:
Figure 2: formula to calculate the global index of eXaminator metric web@x - web at eXaminator
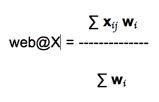
Xij represents the subjective score corresponding to the occurrence j found in a given test i. For example (see table 1):
The Wi corresponds to the weight of each test according to the priority levels of each checkpoint to which they relate.
3. Strategy
To test the correlation between the overall scores of the eAccessibility Checker (UWEM 1.2 metric) and eXaminator, we turn to a bank of pages collected in January 2010 corresponding to the first page of the 308 Portuguese municipalities [9]. In eXaminator we only use priority 1 and 2 checkpoints of WCAG 1.0. Originally, eXaminator also had tests to some priority 3 checkpoints.
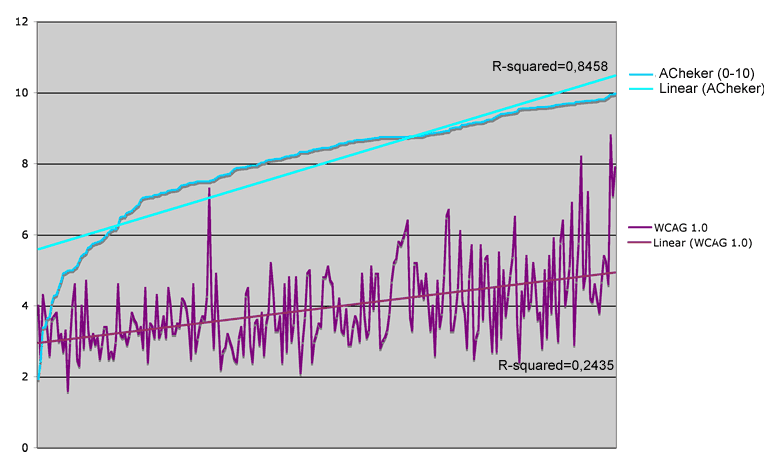
Then we ordered the series by the score of eAccessibility Checker and tried a graphical observation of both scales [figure 3], drawing a line corresponding to a linear distribution (trendline / regression) [see outcomes section of this paper].
To represent both scores on the same scale we transformed the scale of eChecker, originally 0-1, on a scale from a 0 to 10, where 1 in eChecker represents 0 in eXaminator and 0 in eChecker represents 10 in eXaminator. For this purpose we used the following formula:
x=(1-y)*10
x = score of eChecker in a scale of 0-10; y = original score of eChecker.
Finally, we calculated the Coefficient of Pearson's correlation between the scores of eChecker and eXaminator.
4. Major Difficulties
The way the two metrics rank their tests is very difficult to compare. Sometimes it seems that the tools are seeing completely different pages.
5. Outcomes
By observing the two distributions of scores in a graphical form, with the distribution of eChecker scores by order, it is possible to verify that there is some correlation between the two series. The transformation of the two series in a linear representation allows us to conclude that eXaminator's way of scoring yields more conservative scores when compared to eChecker's score. At lower values, the difference is around 2.5 points while, in the higher values, the difference is around 5 points.
The calculation of Pearson's correlation coefficient between the two distributions indicates a value of p = 0.41, which means a moderate positive correlation. But as both metrics are based on the checkpoints of priority 1 and 2 of WCAG 1.0, we expected p-values closer to 1. Can we assume that the disparity in results is due to the conceptual differences between the failure rate and eXaminator strategy? if so, are there alternative approaches? How do you determine which one is the best?
Figure 3: a graphic comparison between the scores
distribution of eXaminator and eChecker
(the scores of eChecker are by order)
6. Open Research Avenues
Since early 2011, we have been using AccessMonitor beta (WCAG 2.0) in the Portuguese Public Administration. Using the same sample and comparing its scores to eXaminator's (WCAG 1.0), we obtain a p = 0,949, which shows a strong correlation between the two metrics. It would be very interesting for us to be able to compare our new tool to another quantitative metric that uses WCAG 2.0.
References
- eAccessibility Checker validator: http://accessibility.egovmon.no/en/pagecheck/
- eXaminator validator (portuguese): http://www.acesso.umic.pt/webax/examinator.php
- AccessMonitor validator (portuguese): http://www.acesso.umic.pt/accessmonitor/
- Brajnik, G. (2007) Effects of sampling methods on web accessibility evaluations. Proceedings of ASSETS'07. DOI: 10.1145/1296843.1296855
- WCAG 1.0 - chapter of conformance: http://www.w3.org/TR/WCAG10/#Conformance
- Fernandes, J. (2009) Web Content Accessibility of the Portuguese Municipalities 2009 - analyzing the first page. (in Portuguese) Lisboa: SUPERA - Sociedade Portuguesa de Engenharia de Reabilitação e Acessibilidade. Setembro de 2009. http://www.supera.org.pt/index.php/actualidades/the-news/27-news/63-municipios09.html
- Fernandes, J. (2011) Study "Compliance of Portuguese Public Administration websites with WCAG 1.0 - 2008 - 2010". http://www.apdsi.info/uploads/news/id410/jorge fernandes.pdff
- UK Presidency of EU 2005. (Novembro 2005) eAccessibility of public sector services in the European Union. Consulted at October 20th, 2007 from http://www.umic.pt/images/stories/publicacoes/eaccessibility(eu)_report.pdf
- Portuguese Municipalities (database of homepages frozen to January 2010): http://www.acesso.umic.pt/cm/