
File:Minard.png
Size of this preview: 800 × 578 pixels. Other resolution: 1,441 × 1,042 pixels.
Original file (1,441 × 1,042 pixels, file size: 153 KB, MIME type: image/png)
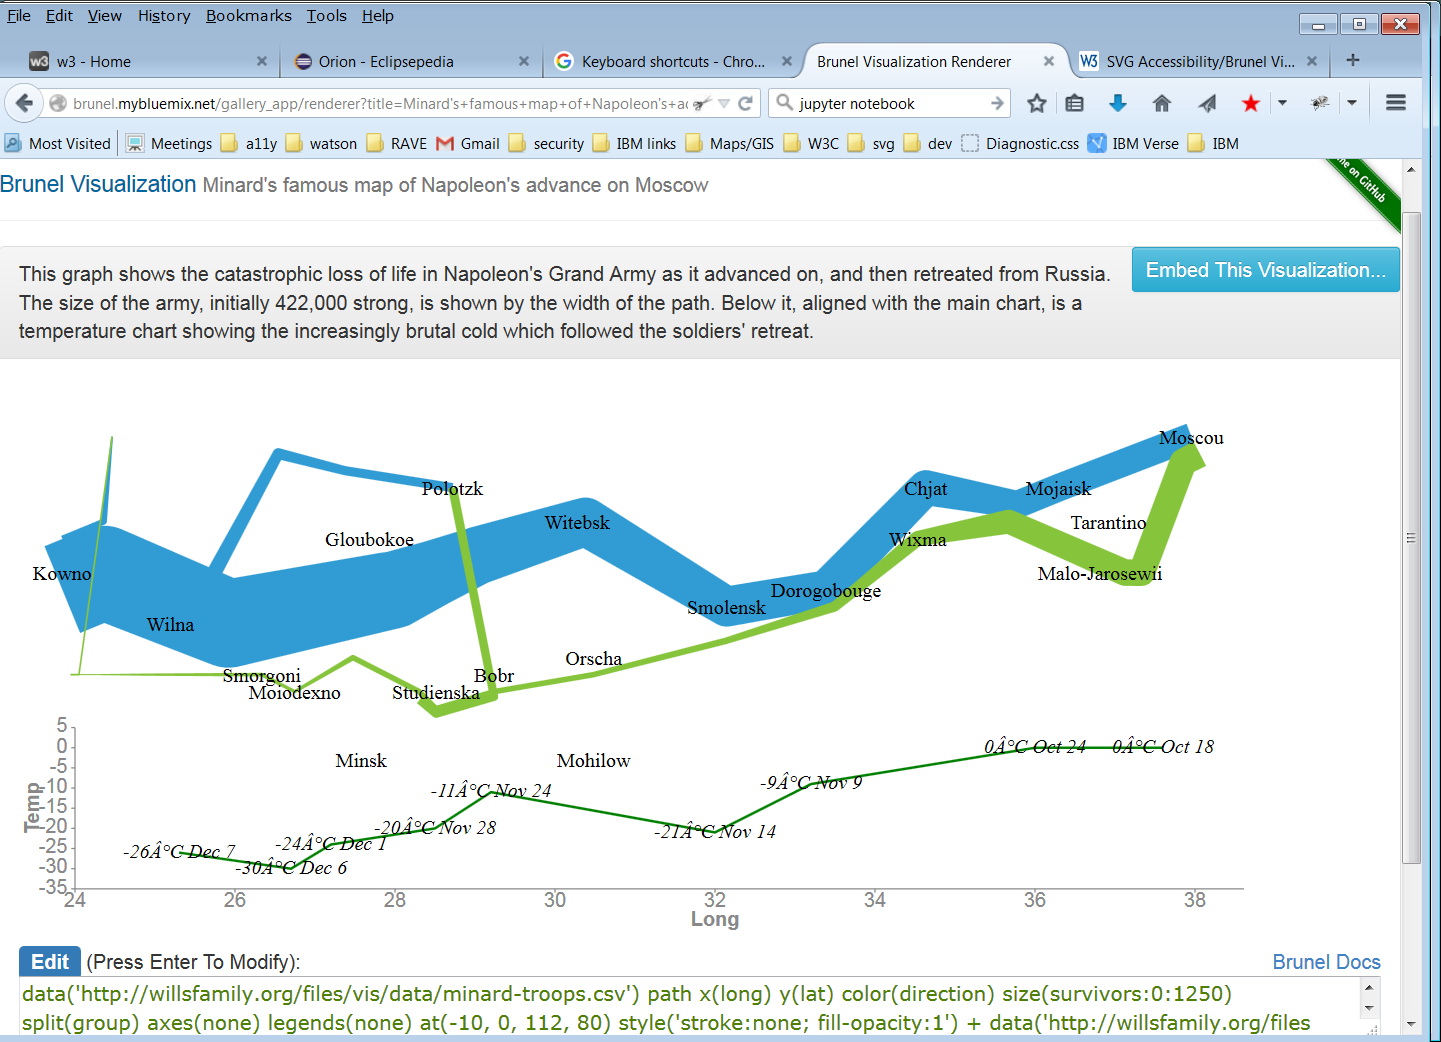
Brunel Visualization Language wikipage screenshot. Note the chart is Minard's famous visualization of Napoleon's march to Moscow. The visualization has two charts vertically aligned. The path element in the upper chart has a split, is colored based on direction and the width represents the number of French troops. Cities are labeled on the march in the upper chart. The lower chart is a line chart with labels with the temperature and date, the X axis being longitude and the Y axis is temperature.
File history
Click on a date/time to view the file as it appeared at that time.
| Date/Time | Thumbnail | Dimensions | User | Comment | |
|---|---|---|---|---|---|
| current | 19:17, 22 September 2015 | | 1,441 × 1,042 (153 KB) | Fesch (talk | contribs) | Brunel Visualization Language wikipage screenshot. Note the chart is Minard's famous visualization of Napoleon's march to Moscow. The visualization has two charts vertically aligned. The path element in the upper chart has a split, is colored based on ... |
You cannot overwrite this file.
File usage
The following page uses this file: