Descriptions of W3C Diversity bar charts - 2018
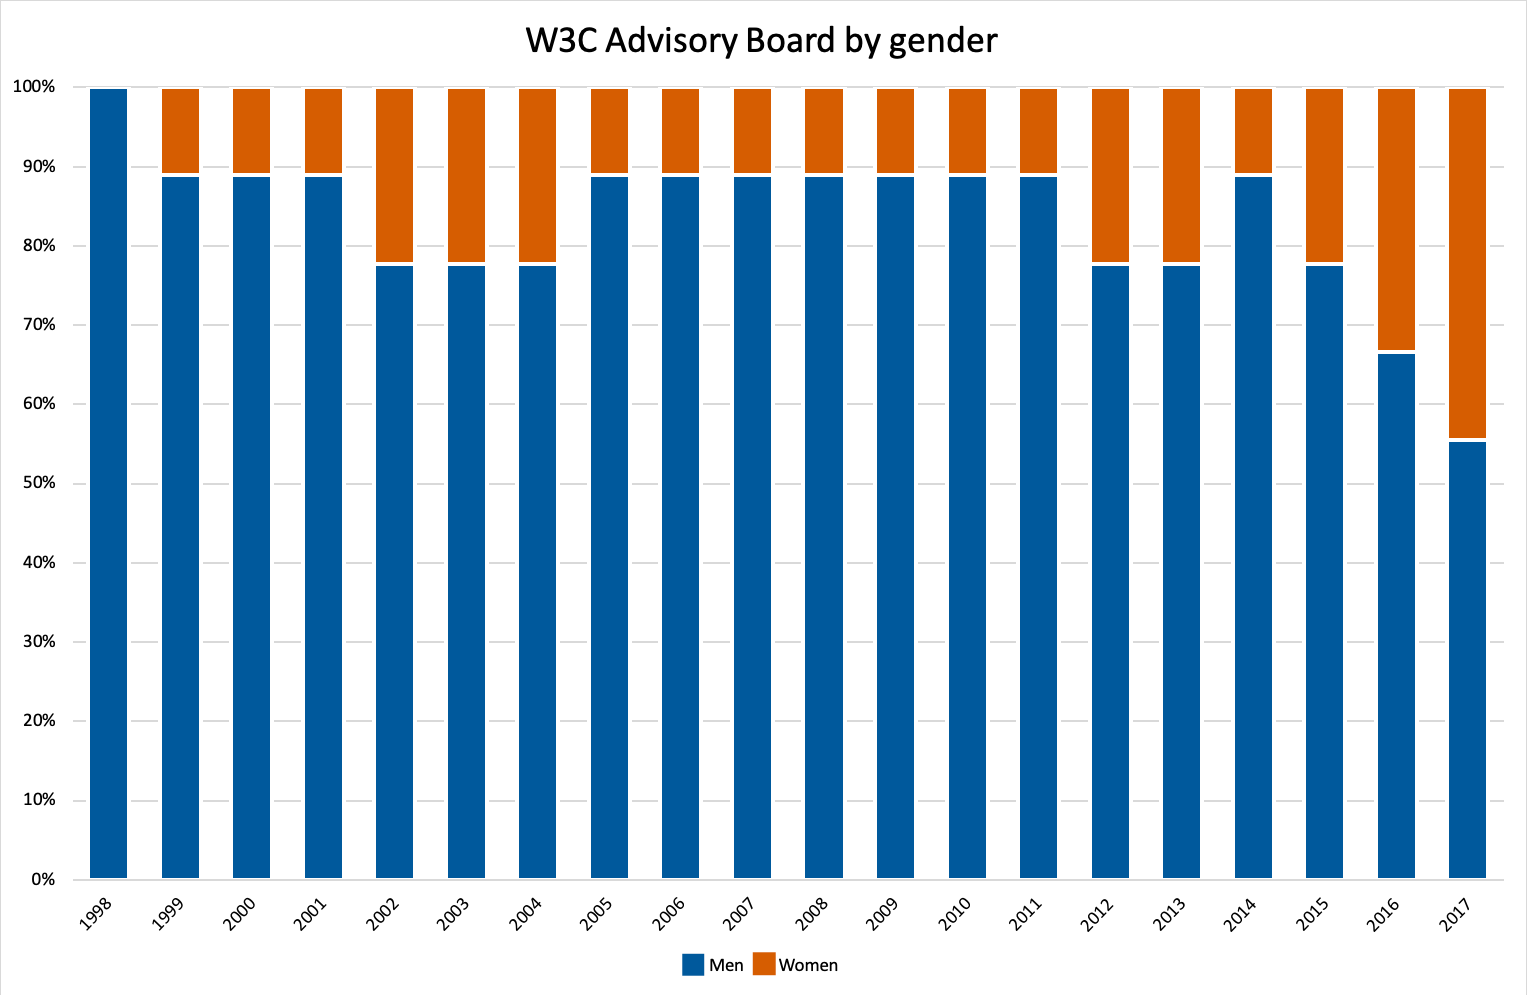
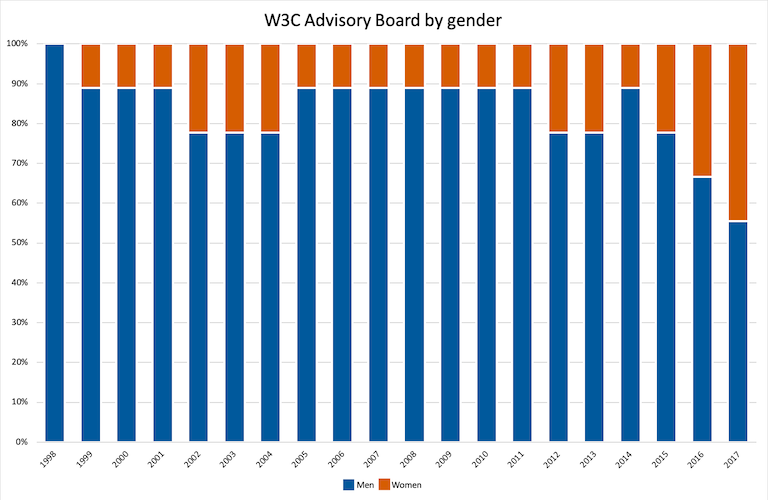
Description of the bar chart: AB by gender
|
Men |
Women |
| 1998 |
9 |
0 |
| 1999 |
8 |
1 |
| 2000 |
8 |
1 |
| 2001 |
8 |
1 |
| 2002 |
7 |
2 |
| 2003 |
7 |
2 |
| 2004 |
7 |
2 |
| 2005 |
8 |
1 |
| 2006 |
8 |
1 |
| 2007 |
8 |
1 |
| 2008 |
8 |
1 |
| 2009 |
8 |
1 |
| 2010 |
8 |
1 |
| 2011 |
8 |
1 |
| 2012 |
7 |
2 |
| 2013 |
7 |
2 |
| 2014 |
8 |
1 |
| 2015 |
7 |
2 |
2016
|
6 |
3 |
2017
|
5 |
4 |
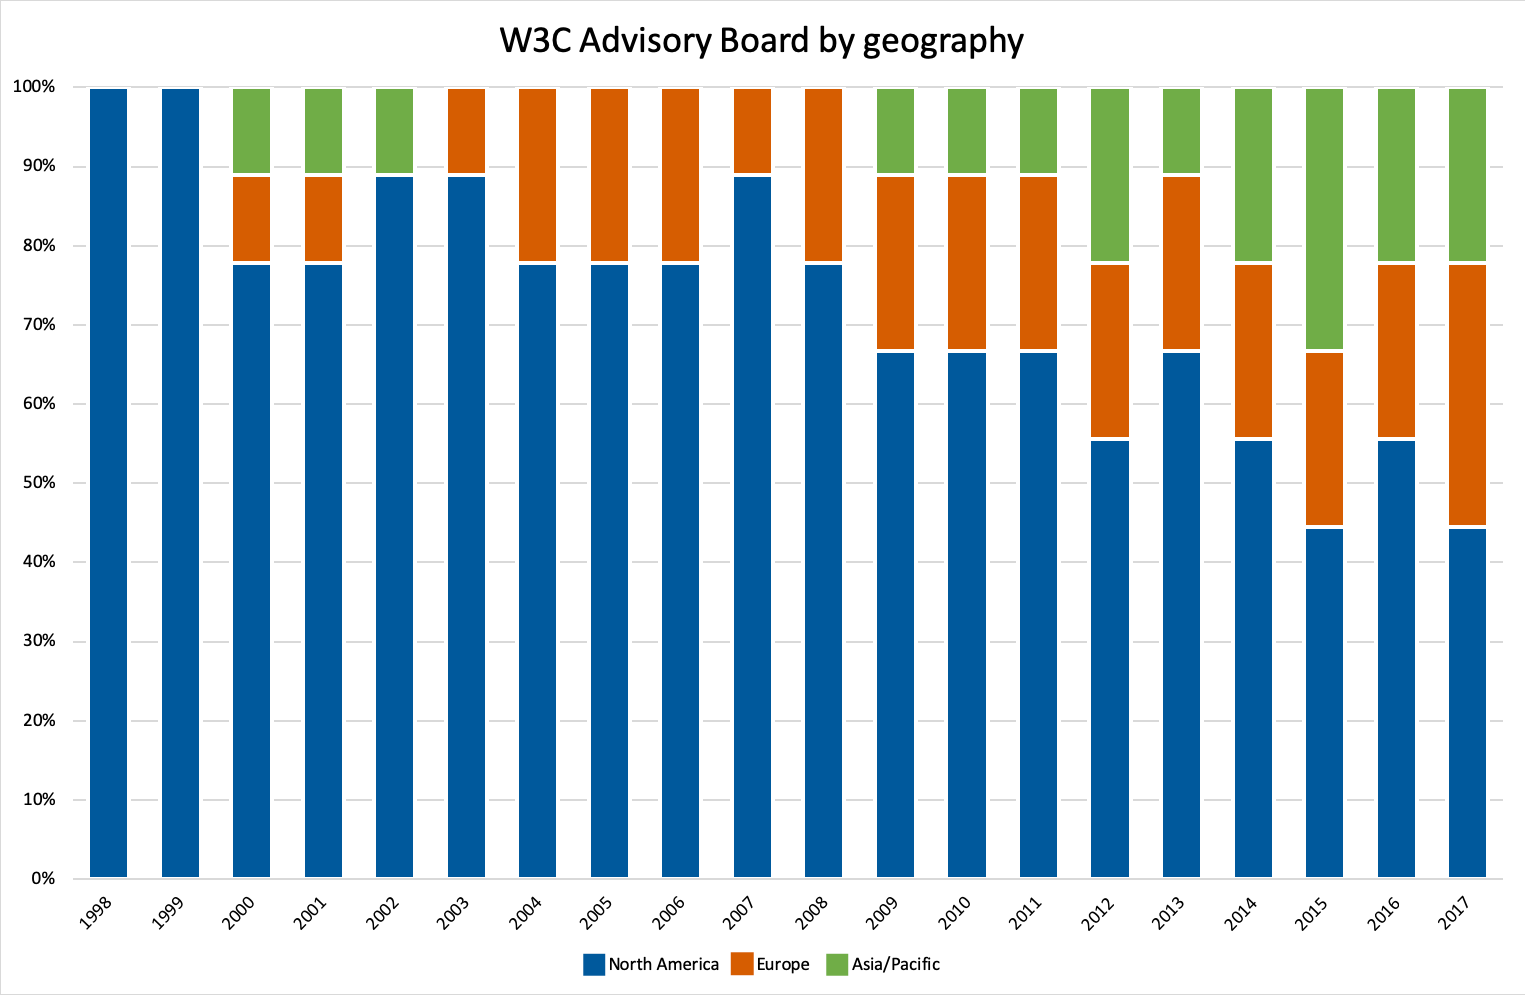
Description of the bar chart: AB by geography

|
North America |
Europe |
Asia |
| 1998 |
9 |
0 |
0 |
| 1999 |
9 |
0 |
0 |
| 2000 |
7 |
1 |
1 |
| 2001 |
7 |
1 |
1 |
| 2002 |
8 |
0 |
1 |
| 2003 |
8 |
1 |
0 |
| 2004 |
7 |
2 |
0 |
| 2005 |
7 |
2 |
0 |
| 2006 |
7 |
2 |
0 |
| 2007 |
8 |
1 |
0 |
| 2008 |
7 |
2 |
0 |
| 2009 |
6 |
2 |
1 |
| 2010 |
6 |
2 |
1 |
| 2011 |
6 |
2 |
1 |
| 2012 |
5 |
2 |
2 |
| 2013 |
6 |
2 |
1 |
| 2014 |
5 |
2 |
2 |
2015
|
4 |
2 |
3 |
2016
|
5 |
2 |
2 |
2017
|
4 |
3 |
2 |
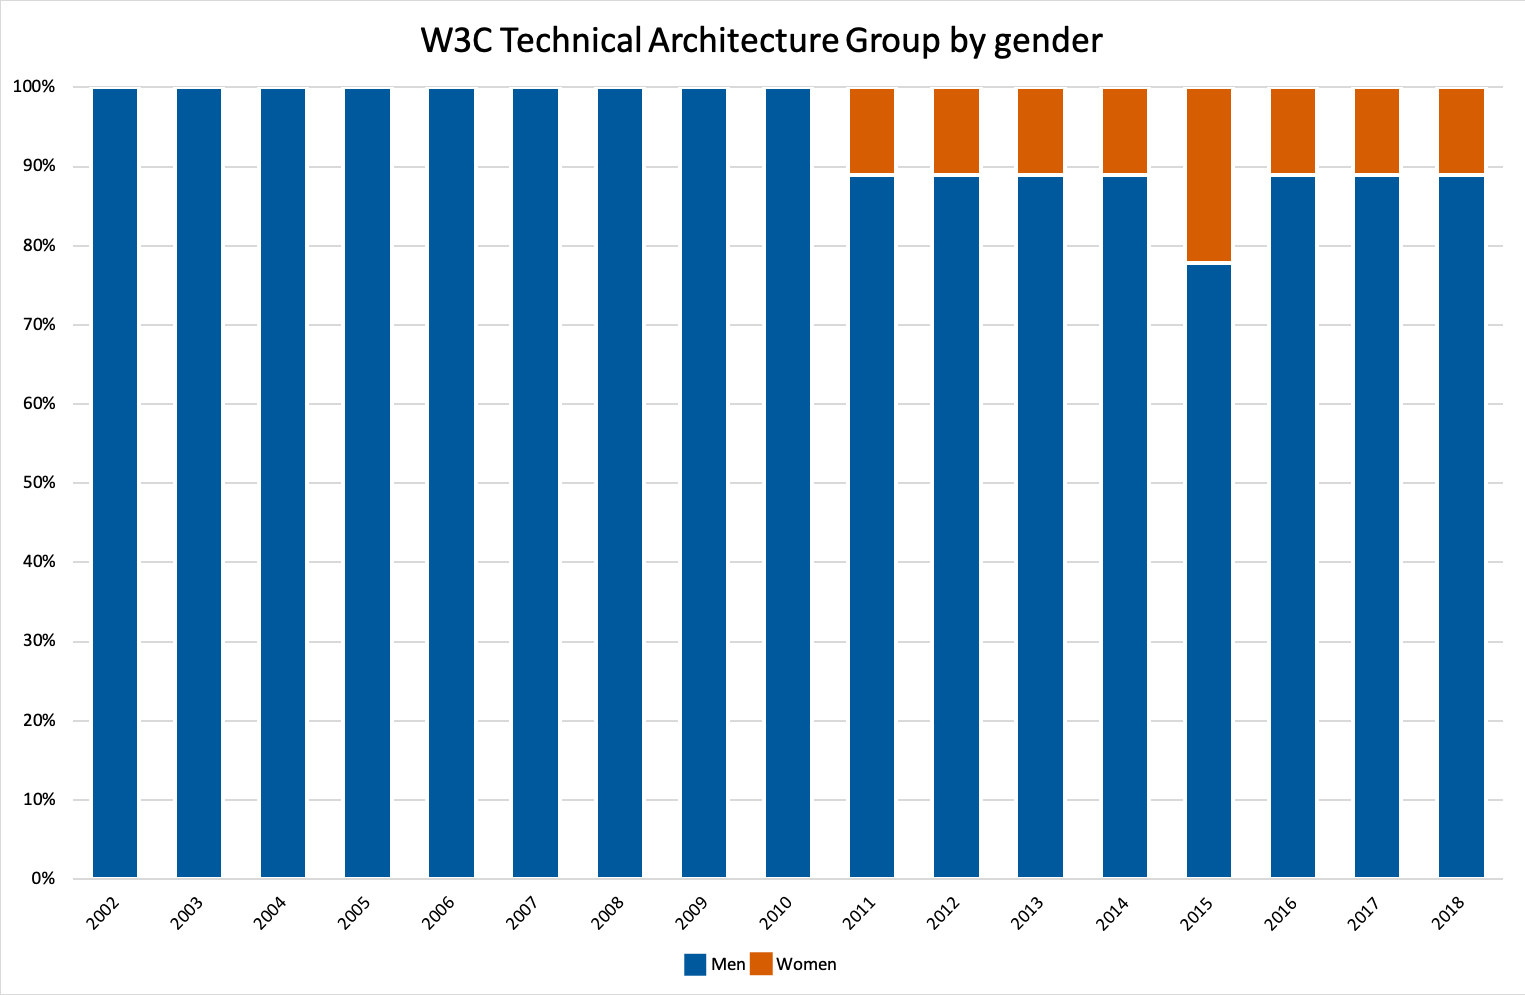
Description of the bar chart: TAG by gender

|
Men |
Women |
| 2002 |
9 |
0 |
| 2003 |
9 |
0 |
| 2004 |
9 |
0 |
| 2005 |
9 |
0 |
| 2006 |
9 |
0 |
| 2007 |
9 |
0 |
| 2008 |
9 |
0 |
| 2009 |
9 |
0 |
| 2010 |
9 |
0 |
| 2011 |
8 |
1 |
| 2012 |
8 |
1 |
| 2013 |
8 |
1 |
| 2014 |
8 |
1 |
| 2015 |
7 |
2 |
2016
|
8 |
1 |
2017
|
8 |
1 |
2018
|
8 |
1 |
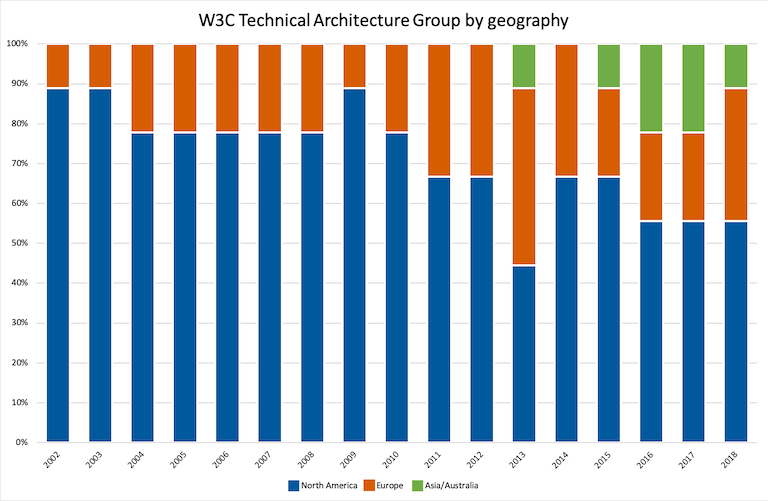
Description of the bar chart: TAG by geography
|
North America |
Europe |
Asia |
| 2002 |
8 |
1 |
0 |
| 2003 |
8 |
1 |
0 |
| 2004 |
7 |
2 |
0 |
| 2005 |
7 |
2 |
0 |
| 2006 |
7 |
2 |
0 |
| 2007 |
7 |
2 |
0 |
| 2008 |
7 |
2 |
0 |
| 2009 |
8 |
1 |
0 |
| 2010 |
7 |
2 |
0 |
| 2011 |
6 |
3 |
0 |
| 2012 |
6 |
3 |
0 |
| 2013 |
4 |
4 |
1 |
| 2014 |
6 |
3 |
0 |
2015
|
6 |
2 |
1 |
2016
|
5 |
2 |
2 |
2017
|
5 |
2 |
2 |
2018
|
5 |
3 |
1 |
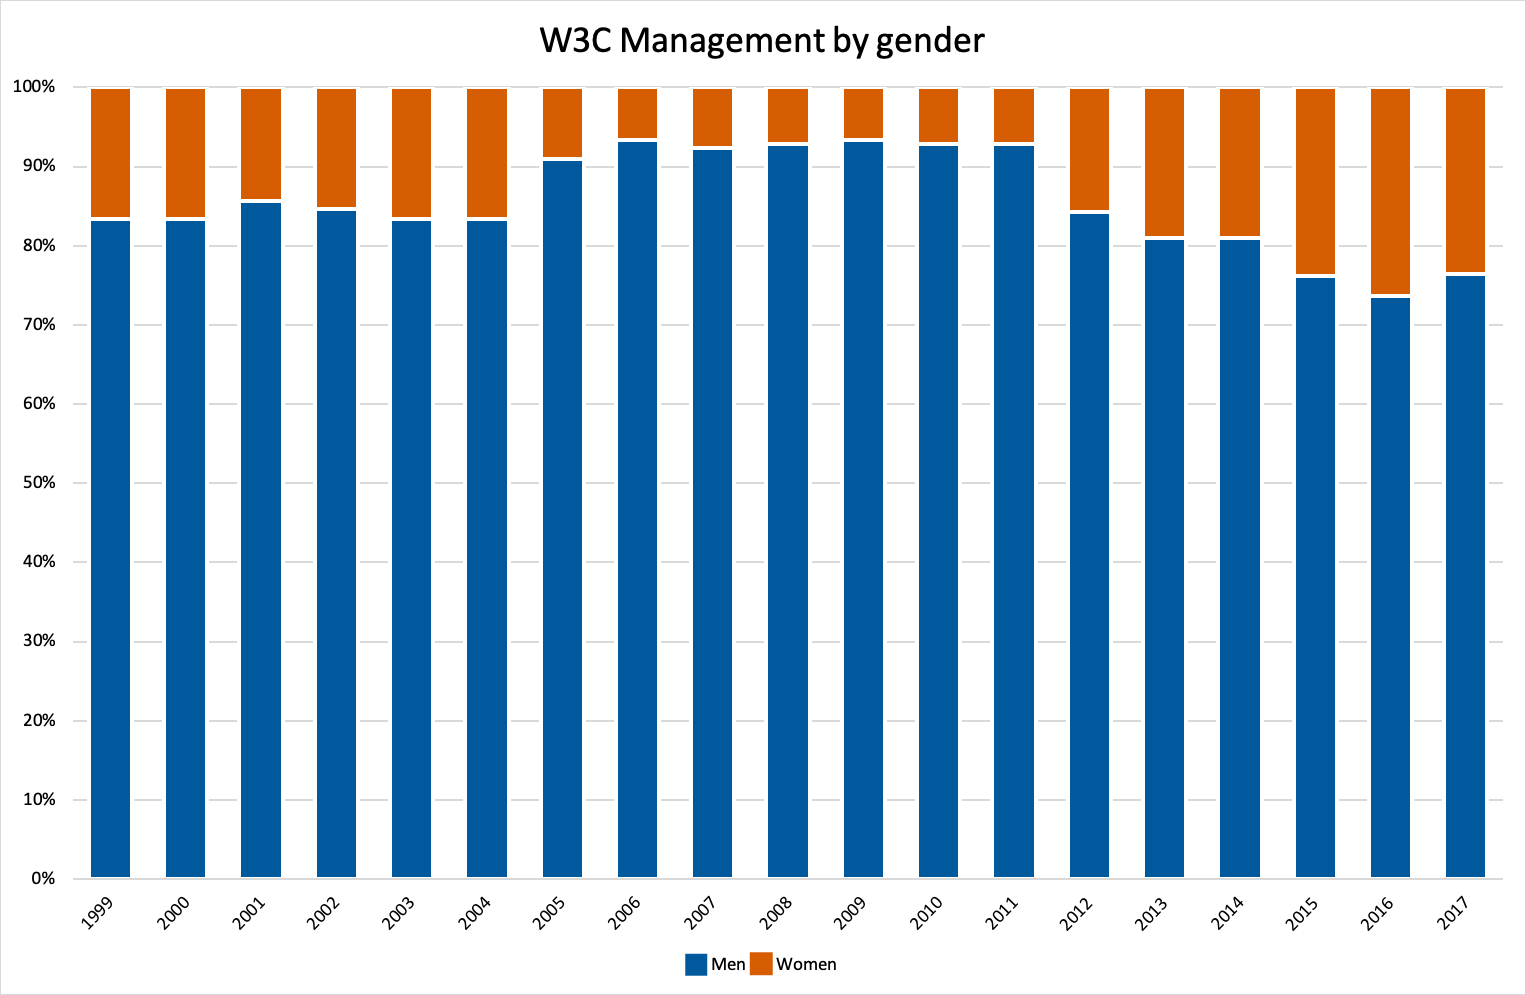
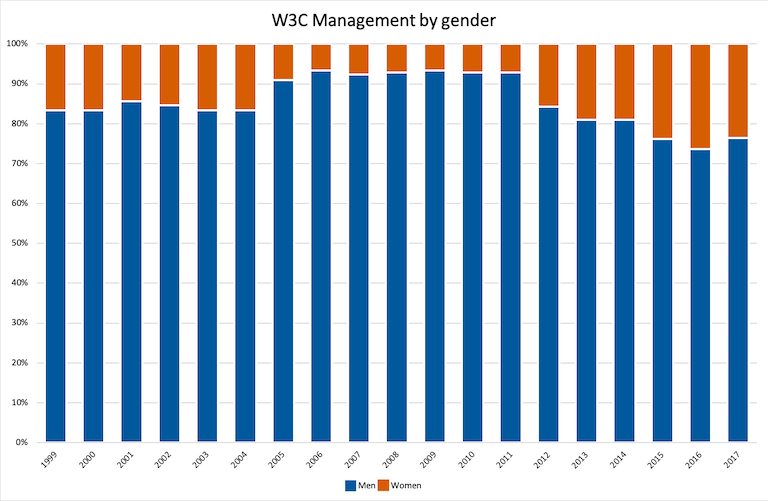
Description of the bar chart: W3M by gender in percentages
|
Men |
Women |
| 1999 |
83 |
17 |
| 2000 |
83 |
17 |
| 2001 |
86 |
14 |
| 2002 |
85 |
15 |
| 2003 |
83 |
17 |
| 2004 |
83 |
17 |
| 2005 |
91 |
9 |
| 2006 |
93 |
7 |
| 2007 |
92 |
8 |
| 2008 |
93 |
7 |
| 2009 |
93 |
7 |
| 2010 |
93 |
7 |
| 2011 |
93 |
7 |
| 2012 |
84 |
16 |
| 2013 |
81 |
19 |
| 2014 |
81 |
19 |
| 2015 |
76 |
24 |
2016
|
74 |
26 |
2017
|
76 |
24 |
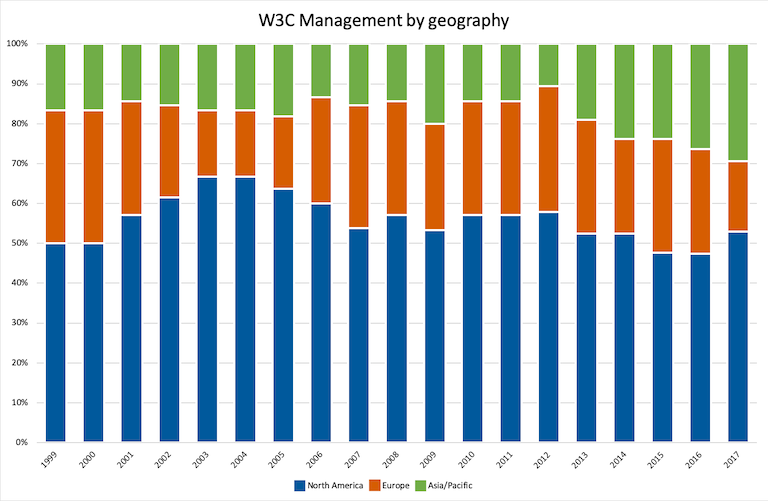
Description of the bar chart W3M by geography in percentages
|
North America |
Europe |
Asia |
| 1999 |
50 |
32 |
18 |
| 2000 |
50 |
32 |
18 |
| 2001 |
58 |
26 |
16 |
| 2002 |
62 |
20 |
18 |
| 2003 |
66 |
16 |
18 |
| 2004 |
66 |
16 |
18 |
| 2005 |
64 |
18 |
18 |
| 2006 |
60 |
26 |
14 |
| 2007 |
54 |
30 |
16 |
| 2008 |
56 |
28 |
16 |
| 2009 |
54 |
26 |
20 |
| 2010 |
56 |
30 |
14 |
| 2011 |
56 |
30 |
14 |
| 2012 |
56 |
34 |
10 |
| 2013 |
52 |
28 |
20 |
| 2014 |
52 |
26 |
24 |
| 2015 |
48 |
28 |
24 |
2016
|
48 |
26 |
26 |
2017
|
52 |
18 |
30 |