Scalable correlated random graph
As the data generator needs to generate a large correlated social graph with limited memory resource and also has to guarantee the scalability of the generation, this note is to discuss our approach for fast and scalable generation of a random correlated graph.
The graph is first divided into tiles in which each tile contains a number of users (i.e., nodes in the graph). Note that at the first time, there is no connection as well as dimensional values for each node in the graph. A window contains a particular number of tiles so that its size can fit in the main memory for the generator. The window slides along these tiles and for each move, one tile is removed from the window and a new one is included in. Then, the correlated data for the nodes in the new tile is generated regarding the data generated for existing nodes in the window.
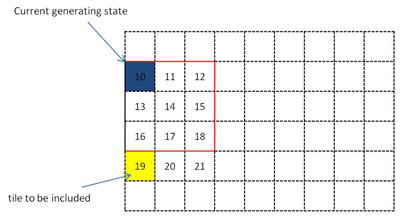
For example, at a current generating state, the window contains all the tiles from number 10 to numeber 18. When the function generating data for this window is completed, the tile No. 10 is removed from the window and the tile No. 19 is included in the window. Then, the generating function re-runs for the window with tile from No. 11 to No. 19.
Here, we assume that each node (i.e., a user) in the graph is associated with three dimensions: geography (user's location), demography (person-age), and interests.
The generation procedure is divided into passes. For each pass, each dimension is included for considering the correlation between the dimension values and the node connectivity. The specific dimension including order is "location, interest, person-age". Each pass is associated with a speed regarding to how the window slides along the tiles.
Thus, the generating function contains these following parameters: P, L(P), D(P), and S(P), in which P indicates the which pass is currently running, L(P) is the current position of the window, S(P) is the speed, D(P) is the input dictionary for the dimension in the current pass.
For this generation, these dictionaries are needed.
1) Dictionary of locations with the latitude and longitude values for each location
2) Dictionary of interests. This dictionary stores the probabilistic distribution of each interest in each region (user's location). Each interest is associated with top-N areas where that interest is popular. For a user living in other location, the probability that he has the interest depends on the latitude and longitude differences between his location and these top-N areas. For example, badminton is popular interest in China, Indonexia, Denmark. The probability that user living in Amsterdam plays badminton is higher than that of user living in Paris as the latitude and longitude of Amsterdam is more similar to those of Denmark than Paris. (See the appendix for how to compute the distribution of interest)
(For simplicity, we may only consider top-N locations for each interest, and simply assign the same distribution for other locations)
3) Dictionary of person-age. This dictionary stores the distribution of person-age according to the interest. (What's about the distribution of person-age in corresponding to the regional information?)
For generating data in each pass, these correlations need to be considered.
- Two users having "friend" relationship (i.e., connected by one edge in the graph) are likely living in the same region. Thus, in the first pass of the generator, the location information of each user is generated based on the friend relationship of that user with the existing one whose location information has already been generated.
- Two users having friend relationship have high probability of having the same interests. This probability is even higher for those living in the same region. Besides, the "interest" information is generated according to its distribution in each location (Dictionary 2). These correlations are applied for second pass.
- Users with similar interests are likely having similar ages. This is for generate data in third pass.
APPENDIX:
A. Computing the distribution of interest for each location:
In order to compute the distribution of an interest for a location, we create a distribution function based on the latitude and longitude values of the location for the interest.
First we find top-3 locations where the interest is popular (We manually find these locations?).
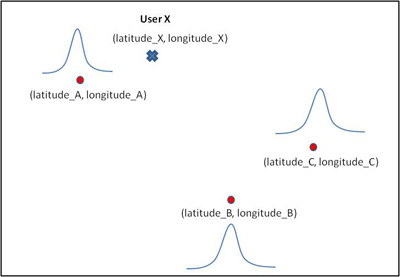
Then, for each location X, we consider that the distribution of the interest in corresponding to the latitude of X follows a normal distribution in which the mean value μ is the latitude of the closet popular area associated with that interest, and the variance value is the farthest distance between each pair of associated latitudes.
Thus, we can compute the probability that a user at latitude_X has that interest by using the above normal distribution function --> Pr(lat_X, interstest_A)
Similarly, we compute the probability that a user at longitude_X has that interest by using the normal distribution function for longitude value --> Pr(long_X, interstest_A)
Finally, the probability that user at location X has that interest is a multiplication of the probabilistic values corresponding to latitude_X and longitude_X.
--> Pr(X, interstest_A) = Pr(lat_X, interstest_A) * Pr(long_X, interstest_A)
================================================
Pass 1: Generate the friendships along with the location dimension.
For each window of cells (or tiles), consider the users in the first window.
- For each user, generate the number of friends that the user has according to power-law distribution.
- Calculate the number of friends that will be generated in this location-based pass (= totalNumberOfFriends * probInLocationPass).
- Generate the location information of the user according to the distribution of the dictionary. Note that, the location information generated is the country name. When writing to output file, each location will be the name of one randomly generated city in that country.

