
File:SVG-UC-ClusterBar.svg

Size of this PNG preview of this SVG file: 512 × 228 pixels.
Original file (SVG file, nominally 512 × 228 pixels, file size: 8 KB)
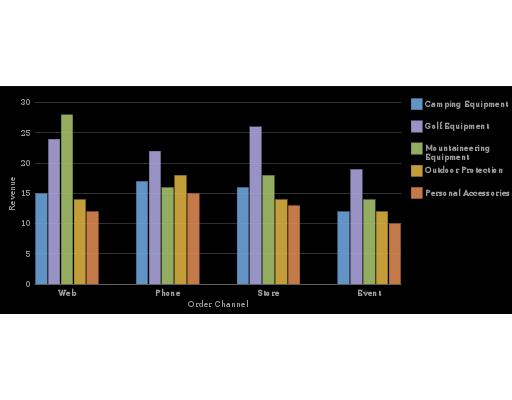
Another bar chart. The Y axis is numeric, describing revenue, the X-axis contains 4 clusters of 5 bars each. The clusters represent the source of orders (web, phone, etc) groups, the individual bars, colour coded and identified by a legend, represent different types of product.
Visually the clusters are well-separated, which helps to interpret them "at a glance", unlike some other bar graph examples we have.
File history
Click on a date/time to view the file as it appeared at that time.
| Date/Time | Thumbnail | Dimensions | User | Comment | |
|---|---|---|---|---|---|
| current | 09:45, 13 April 2015 | | 512 × 228 (8 KB) | Charles (talk | contribs) | Another bar chart. The Y axis is numeric, describing revenue, the X-axis contains 4 clusters of 5 bars each. The clusters represent the source of orders (web, phone, etc) groups, the individual bars, colour coded and identified by a legend, represent d... |
You cannot overwrite this file.
File usage
The following page uses this file: