Visualing Search Engine Result of Data-Driven Web Content
Shuangbao Wang, Jim X. Chen and Michael M. Behrmann
Helen Kellar Institute for Human with disabilities, Department of
Computer Science
George Mason University
4400 University Drive, MS 1F2, Fairfax, Virginia
U.S.A.
Abstract
With the fast growth of online information, people with reading disabilities always have trouble in finding and understanding the information of their interest.
In this paper, we use a term-weighted vector method to represent the documents and queries. Search results therefore can be presented by the degree of correspondence to the query. We further implemented a visualization system called InfoVisual using C++ and OpenGL to display the search results in multiple dimensions. To retrieve the information, we also developed a dynamic search engine that can retrieve all the information related to a webpage no matter whether it is static, database driven or program generated.
Key Words
Visualization, Web Accessibility, Search Engine, Database, OpenGL
1. Introduction
Visualization techniques have proved valuable for applications in scientific research, engineering, medical imaging and many other areas. Visualizing query results generated by a search engine reveals the spatial relation between queries and results, and gives people a spatial perspective of the data, which cannot be "seen" by the classical tabular view.
InfoVisual is a visualization system we implemented to display the
search results. Queries and search results are displayed using
different three-dimensional objects (icons). The distance between a
document and a query reveals the degree of correspondence between
them. Document details can also be displayed if the corresponding
document icon is clicked.
2. Design and Implementation
2.1 Vector Space Model
Unlike Boolean or fuzzy model, Vector space models represent the documents and the queries by a set of possible weighted content terms. The weight of the term reflects its importance in relation to the meaning of the document or query.
2.2 Automatic Indexing
To represent the weight wi,j measuring the relative importance of each concept or single term Tj, j=1, 2, ..., t, in a document Di, we use the following formula:
![]()
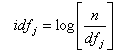
where is the frequency of the term Tj in the document Di, n is the number of documents, is the number of documents in which Tj occurs, and is the inverse document frequency.
2.3 Database Connectivity and Dynamic Search
As our example, the T/TAC Online (Virginia Training and Technical Assistance Center Online for people serving children and youth with disabilities) web application consists of three logical tiers: the first tier is data that are stored in a SQL server database, the second is an XML-based business object, and the third is the user interface. The data tier is the T/TAC database. The business object is the XML Web Service tier that connects to the data, and distributes it to the user interface. The user interface includes applications for the web clients.
At begining, the search engine calculates the term frequency and the inverse document frequency . If the match results are good enough and exceed a certain threshold, the search engine stop the searching process and return the results. Data retrieved from database are in the form of XML format. It then be transformed into HTML using a XSL.
2.4 Visualizing the Search Results
The visualization algorithm takes the query key terms (keywords) as points of interest. Documents represented by three-dimensional objects (icons) are positioned in the multi-dimensional space based on the frequent count of word matches in the document to key terms in the points of interest. Using computer graphics and scientific visualization techniques, the terms and documents are projected onto a raster display for viewing by the clients.
2.4.1 Calculate the Weight of the Documents
After pre-calculating the normalized inverse document frequency , we compute the weight of term in the documents:
![]()
2.4.2 Algorithm to Determine the Document Location in the Screen
Figure 1 shows the computation process of the algorithm for position a document. In this example there are three queries at position A, B and C. First, program calculates the intermediate position t between the queries at A and B using:
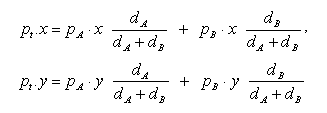
Next, program calculates the final position s of the document, which is in the line of point t and C using the formula similar as above.
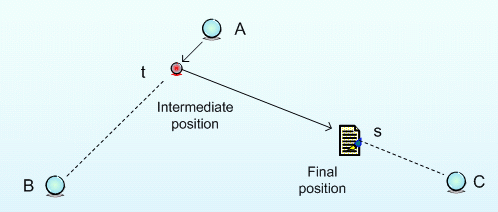
Figure 1. Execution Process of the Position Algorithm
In the algorithm, we use a stack to represent the set S. There are
seven stack operations: InitialStack(S), Empty(S), Push(S, x), Pop
(S), GetTop(S), Clear(S) and CurrentSize(S). The function add to set
S is implemented as the stack Push operation; and function remove
from S is implemented as the stack Pop operation.
2.5 Experiments and Results
Figure 2 shows the graphic user interface of the InfoVisual visualization system. The display screen is divided into three views. The main view displays the queries and documents; the document view shows all the files that is related to the queries; and the information view gives detailed information about documents and queries. If clients want to see the details of a specific document, they can do it by clicking the icon of the document.
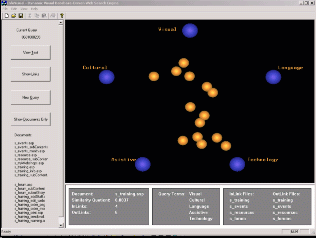
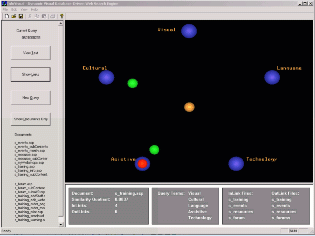
Figure 2. Graphic User Interface (GUI) of InfoVisual
3. Acknowledgement
The research is supported partly by a grant from Virginia DOE. The authors also want to thank the Graduate School of Education Instructional Design and Development Immersion Students (class '00-'03) at George Mason University for their dedicated support.