 A Generic Map Interface to Query Geographic Information Using the World Wide Web
A Generic Map Interface to Query Geographic Information Using the World Wide Web
A Generic Map Interface to Query Geographic Information Using the World Wide Web

Environmental information is intrinsically geographically-related. It pertains to a specific region of the earth. Users of such information require answers to questions that have a geographic basis.
The Environmental Resources Information Network [8] Unit has developed a generic WWW map interface using a collection of simple map images and a standard lookup table to provide visual interactive access to geographically-related information.
The map interface provides a generic mechanism to define a region of interest before selecting from various online forms interfaces to geographic information such as biological species distributions, a spatial data set directory, project information, bibliographies, and general textual indices of WWW documents.
Spatial, Geographic Information Systems (GIS), Geospatial, Map, Environmental, CGM, Scribble, ERIN, Imagemap, Vector, Search
The Environmental Resources Information Network [8] is establishing a series of online information services that allow ready access to key information about the Australian environment through an easy-to-use interface. This information is maintained by various custodians over the network.
The World Wide Web (WWW) can be interfaced to other data sources such as relational databases, mapping and modelling tools, text indexing facilities, and geographic information systems to provide direct access to spatial information.
A high-quality interactive map interface can be achieved without the overhead (in both response time and running costs) of an online proprietary Geographic Information System (GIS). Other techniques such as pre-prepared static maps and dynamic map generation with graphics packages can do most mapping. Integrated WWW-GIS resources can then be directed at more complex spatial analysis without being bound up by simple map production.
The ERIN Unit has developed a generic map interface that allows the user to interactively define their region of interest. The interface uses static maps at various scales and the Imagemap facility to allow zooming and panning of the map images and selection of the region of interest.
Users can then select the type of information that they are interested in and retrieve this information using a combined geographic and keyword search.
The interface has been designed to be modular and expandable so that new map interfaces and new facilities to access geographic information can be easily configured.
A comprehensive spatial interface will require many different means of defining a geographic region of interest. Some are:
Various WWW facilities are currently available to build spatial interfaces to address some of these methods:
The current WWW facilities are rather limited. The single click imagemap is obviously the most notable limitation. This prevents the definition of multiple regions, disjunct regions, and regions of complex shape (beyond a simple bounding rectangle).
Some future facilities, which will become available when WWW browsers support HTML 3.0, will assist with building comprehensive spatial interfaces. These developments are briefly discussed in the section "Future Directions," and include:
This paper will now go on to describe the online service that has been developed by the ERIN Unit to work around some of the present limitations.
The WWW facility, "Imagemap," provided by the Common Gateway Interface [2] allows a simple and effective spatial interface.
The imagemap facility comprises a raster image as the user interface, the Imagemap program [20], and a lookup file of image regions and related URLs. Imagemap transforms the image coordinates of a single click into effective URLs.
An imagemap of Australian World Heritage Areas [30] allows the user to gain access to documentation concerning Kakadu National Park by clicking on the relevant portion of the Northern Territory of Australia.
Here is the relevant line for "Kakadu" from the imagemap lookup table:
   rect /portfolio/dest/wha/fossil.html 168,100 247,135
   rect /portfolio/dest/wha/kakadu.html 111,29 251,77
   rect /portfolio/dest/wha/wtropics.html 247,93 305,126
Imagemap can also be used to pass parameters to another CGI script. This feature enables the provision of a host of spatial data services and is central to the ERIN Spatial Interface.
This line from one of the imagemaps of the "Mapsheet Information" service at ERIN shows how a parameter can be passed to a CGI script to generate a locality map for the "Jervis Bay 1:100,000 mapsheet."
rect /cgi-bin/mapsheet_lookup.pl?map_number=9027 502,331 520,344
When a client first accesses the spatial interface an initial page is generated and presented with the currently defined region as the extents of continental Australia.
The front page, shown in Figure 1, has two separate forms:
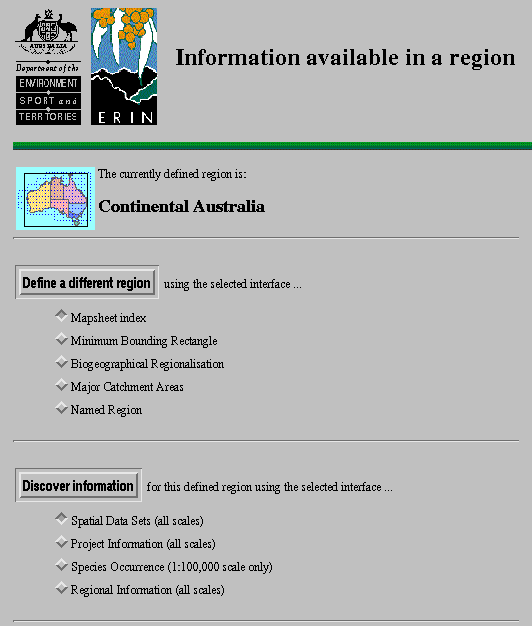
Figure 1. ERIN spatial interface at URL:http://www.erin.gov.au/cgi-bin/spatial_interface
By default, the region of interest is set to the whole of continental Australia. The area of interest can be changed by choosing the "Define a different region" button.
Several different methods of defining the region of interest are available using map sheet series, geographic (latitude/longitude) coordinates as well as biogeographic regions, catchment regions, and lists of named regions that are under development.
Choosing the mapsheet index option presents a map of Australia and a choice of what type of region to define: state, 1:1,000,000 mapsheet, 1:250,000 mapsheet or 1:100,000 mapsheet.
After choosing a region type, a single mouse-click on the map will select the new region of interest. The initial page is returned with the newly defined region of interest.
If needed, the region of interest can be further refined by zooming-in to the State and 1:1,000,000 maps as shown below:
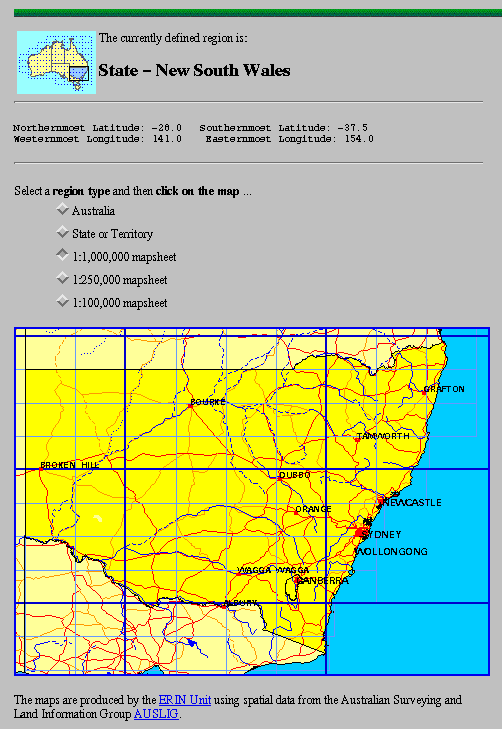
Figure 2. Defining a new region for the "Sydney 1:1,000,000 mapsheet" using the New South Wales (NSW) map.
After the region of interest has been defined, a choice of various subject-specific interfaces provides access to information which relates to the currently defined geographic region.
At present the following interfaces are provided:
An interface is then chosen from the above list. Pressing the "Discover Information" button will present a subject-specific query form to allow the definition of other parameters to further refine the query. Submitting the form to the server will conduct the search and return the relevant document or list of hits.
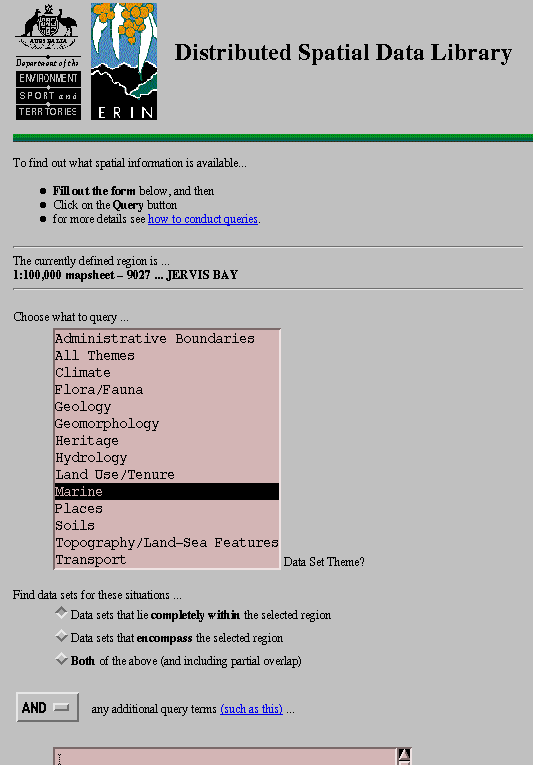
Figure 3. shows part of the query interface for "Spatial Data Sets."
This would be a typical query to discover spatial data sets:
   Show a list of all MARINE data sets, documents, and associated
   information that pertain to the Jervis Bay region of south-eastern
   New South Wales and that mention the phrase "seagrass dieback"
   together with the acronym CSIRO.
These subject interfaces can be easily added to, as other geographically related information services are made available.
Some probable future developments using the ERIN map interface are:
The interface uses an integrated collection of pre-prepared imagemaps at various scales (continental, state, regional, and 1:1,000,000 mapsheet). The imagemap is imbedded in an HTML form to allow the definition of other parameters in conjunction with the mouse click on the imagemap.
Behind the scenes, and underlying all maps, lies a logical and hierarchical mapsheet index as a lookup table. This simple file provides a means to geographically register all map images that comprise the interface. Any map or pick-list of named regions can be configured as an additional interface.
The central aspects of the interface that allow the integration of various maps are:
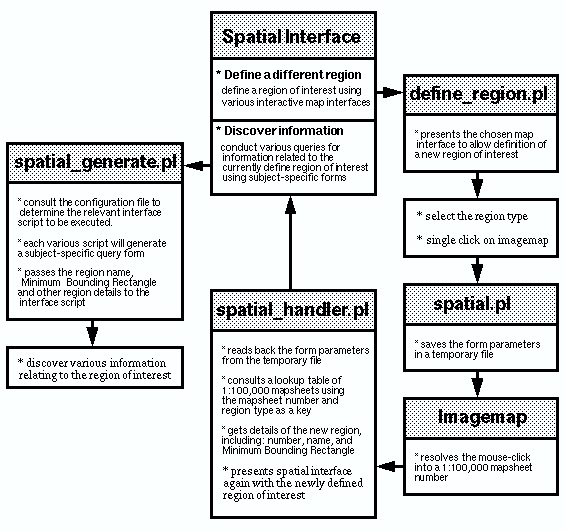
Figure 4. indicates the interaction of the various components of the interface.
A collection of GIF images is pre-prepared to depict the various map interfaces (Australian, State, 1:1million, biogeographic regionalisation [IBRA], major catchments--this set comprises about 50 maps). Finer resolution maps could be prepared. However, bearing in mind that each level of zoom means an order of magnitude of more maps, this is considered a good cutoff point where dynamic map generation should take over.
We use ARC/INFO GIS scripts to do this so that we can continually refine the maps.
An imagemap is prepared for each of the various maps.
Some imagemaps have irregular polygons and are prepared by hand. It is possible that the GIS could be used to provide a very generalised polygon at map image resolution as a string of coordinates. This could be automatically mapped to image coordinates to build the imagemap lookup table.

Figure 5. The Interim Biogeographic Regionalisation of Australia [19] (Australian Nature Conservation Agency (1995) "IBRA digital data set")
Here is the relevant line for the Cape York Peninsula (CYP) region of northeastern Australia from the "Biogeographic Regionalisation" imagemap:
poly /cgi-bin/spatial/spatial_handler.pl?CYP 441,13 430,69 433,102 460,110
                                             485,108 485,95 465,86 441,13
Some imagemaps have a regular index grid of 1:100,000 mapsheets and are automatically produced by an imagemap building script. This script simply consults a lookup table of region numbers and their Minimum Bounding Rectangles. It calculates the image coordinates for each mapsheet to build the imagemap table.
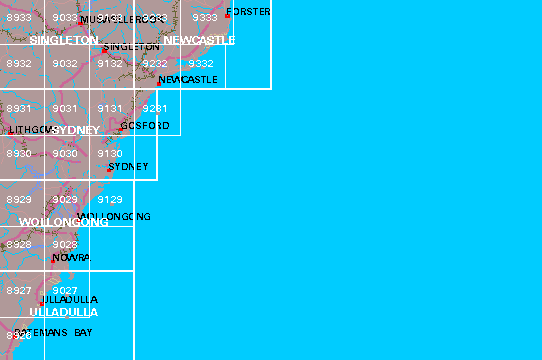
Figure 6. Imagemap for the "Sydney 1:1,000,000 mapsheet"
Here is the relevant line for the "Jervis Bay 1:100,000 mapsheet" from the "Sydney 1:1,000,000" imagemap:
rect /cgi-bin/spatial/spatial_handler.pl?9027 45,270 90,315
This whole set of files forms a static collection of various map interfaces. Other maps can be configured at any time by adding entries to the table of region details.
The thumbnail images, which provide immediate graphical feedback about the currently defined region, are mostly dynamically generated. There are only 10 static images for Australia and each state, but there are about 3800 possible regions.
Thumbnail images are prepared using simple calls to a graphics package [14] by overlaying a pre-prepared thumbnail base map of Australia with a red filled rectangle to depict the minimum bounding rectangle of the currently defined region.
More sophisticated map preparation is possible using the scripting language provided by the utility package "GDInTerpreter" [15] which allows you to take a pre-prepared map image, overlay filled and coloured objects of any shape, add text, cut and paste sections from other library images, and even overlay an existing transparent image (such as roads and rivers) over the top. The prepared map can then be sent back to the client as an inline GIF image.
Hidden form variables are used to maintain certain information about the state of the query. Knowing some information about the last query allows us to pass some crucial details about the region of interest to other CGI scripts.
Here are some of those hidden variables. You can always use "View Source..." on your browser to see hidden variables.
<INPUT TYPE="hidden" NAME="region" VALUE="100k">
<INPUT TYPE="hidden" NAME="map_name" VALUE="9027">
<INPUT TYPE="hidden" NAME="last_region" VALUE="million">
<INPUT TYPE="hidden" NAME="last_map" VALUE="SI56">
<INPUT TYPE="hidden" NAME="desc_region"
                     VALUE="1:100,000 mapsheet - 9027 ... JERVIS BAY">
<INPUT TYPE="hidden" NAME="mbr" VALUE="-35,151,-35.5,150.5">
There is a lookup table of region details for all of the various maps. Using the region identifier and region type as a key, the lookup table is consulted to determine the details of the new region to be defined. These comprise the simple details (name, number, minimum bounding coordinates) and also the higher-level (smaller scale, coarser) regions of which this region is a member.
9027,JERVIS BAY,-35,151,-35.5,150.5,NSW,SI56-13,SI56,MAP-100
One script calls another by writing the variables to the QUERY_STRING CGI environment variable and "exec"ing the next script.
Another way is to issue a server directive to run another CGI script: Location:/cgi-bin/scriptname?name=value&name=value
A simple zoom and pan facility is enabled by embedding the imagemap in an HTML form. In this way additional parameters can be defined along with the imagemap click. For example, the user can select "Region Type = state" and click on the image. The imagemap program resolves the mouseclick into a 1:100,000 mapsheet. Then the CGI script consults the lookup table of region details to determine which state map covers that 1:100,000 mapsheet.
Integration of the WWW and other systems such as Relational Database Management Systems (RDBMS), Geographic Information Systems (GIS), or Wide Area Information Servers (WAIS) has been possible using the ERIN map interface.
This is achieved by the combination of a region defined using the map interface with keyword parameters specified using HTML forms.
After the user has defined the region of interest, they can select the type of information they are interested in and generate a query form to access this information. The subject-specific forms interface may then access a relational database, GIS mapping or modelling packages, and document indices.
For example, the "Species occurrence" interface [26] enables users to find out what species occur in a particular region by accessing the ERIN ORACLE database. This is an integration of data held by various agencies and contains over 1.1 million records of the occurrence of Australian plants and animals.
The spatial interface page has two separate forms: one for "Define a different region" and one for "Discover information." Each form contains hidden parameters defining the current region of interest.
The region of interest that was defined using the spatial interface can then be passed as a parameter to various other CGI scripts. This is achieved by consulting the simple interface configuration file to determine which CGI script to execute for the chosen query interface.
Each line of the configuration file has four fields which represent:
keyword, interface name, relevant scales, CGI script
sp_reg##Species Occurrence##100k##species_interface.pl
The ERIN Spatial Interface, together with supporting technical documentation, is available at URL:http://www.erin.gov.au/cgi-bin/spatial_interface
The present interface has some limitations due to the support for only a single-click imagemap in HTML 2.0. Users can only indicate a limited area of interest using a single mouse click rather than being able to define their own complex areas of interest via multiple clicks, drags, or lines. Some of the developments with HTML 3.0 [18] will help to overcome these limitations.
The specification for HTML 3.0, which is currently being developed, includes the figure <FIG> element to define in-line figures within HTML documents [12]. This new element provides many improvements over the present <IMG> element including defined captions, text flow around figures, alignment control, image overlays, and the ability to define hotzones in the image using HTML. The advantage of defining the hotzones using HTML is that the Web browser can interpret the HTML on the client side and make the appropriate request to the server based on where the user clicks.
This is much faster than the present method, which requires using the imagemap program on the server to resolve where the user has clicked.
Figures can also have transparent overlays. For example, a satellite image basemap can be overlain by a map of roads and rivers. Using overlays for small changes to images can make more effective use of image caching by Web browsers. The browser will cache the basemap because it has not changed and simply retrieve the new overlay from the WWW server.
HTML 3.0 provides some extensions to HTML forms [13] These include a new type of input field called SCRIBBLE [25]. The user is presented with an in-line image that they can click on multiple times using the mouse or by drawing with it. When the form is submitted to the server all of the mouse actions are passed. This provides a means for the user to define a more complex geographic area such as a bounding box or polygon.
Zooming and panning of map images is faster if it is done on the user's workstation without having to access the server. Client-side programmming languages like HotJava from Sun Microsystems [17] or the Common Client Interface [1] used with NCSA Mosaic provide a means of interfacing Web browsers with other programs.
There is a good demonstration of "A Dynamic GIS Interface" using HotJava and the "Smalltalk" GIS engine. This was built by staff at the Argonne National Laboratory [27]. For those with no HotJava client, there is a slideshow accessible by normal WWW browsers. [28].
There is also a current proposal for a client-side imagemap. This would use an HTML extension to allow clickable images to be processed without requiring server intervention [6].
Electronic maps can basically be presented in two ways: as a bitmap (raster) image and as a vector file. A raster image is composed of coloured cells or pixels. A vector file describes a drawing using lines, arcs, filled and shaded polygons, and other objects.
When a raster image is magnified or zoomed it effectively loses clarity because the pixels themselves become enlarged. However, when a vector file is zoomed the linework remains clear because it is simply redrawn at the new scale and the line thickness is maintained.
A vector file has many advantages that will prove useful for WWW spatial interfaces:
It is envisaged that inline vector files would be embedded in the <FIG> element of HTML 3.0.
There are a number of candidate file formats for an inline vector file on the WWW:
The ERIN map interface provides a generic method of access to geographical information through the World Wide Web. The interface is modular and expandable so that new maps of geographic regions and new interfaces to information can easily be added.
In 1992 David joined the Environmental Resources Information Network (ERIN Unit) and worked on data set loading, data validation and quality control, and then as scientific computing support on the Cape York Peninsula Land Use Strategy [7].
Since 1994 he has been Geographic Information Systems Manager and involved with providing spatial information system facilities on the ERIN and developing the spatial and indexing aspects of the ERIN On-line Services.
Tony Boston
Database and On-line Systems Manager
Environmental Resources Information Network [ERIN]
Department of the Environment, Sport and Territories
GPO Box 787 Canberra ACT 2601 Australia
tony@erin.gov.au
Tony Boston is the Database and On-line Systems Manager at the Environmental Resources Information Network (ERIN). ERIN is a unit within the Commonwealth Department of the Environment that is providing ready access to key information on the Australian environment. Since joining ERIN in 1990 Tony has managed the development of the ERIN database to store information such as records of the distribution of Australian plants and animals. In 1993 he set up the ERIN Gopher and World Wide Web servers to make ERIN's information more easily accessible and has developed several interfaces from the Web and Gopher to the ERIN database.
Tony graduated with a Bachelor of Science (Hons) degree majoring in Geology from the Australian National University in 1983. After working as a Petroleum Geologist in industry for several years, he moved into the computing field working at the Bureau of Mineral Resources and completed a Graduate Diploma in Computing Studies from the University of Canberra in 1992.
His main interests lie in the development and use of computer applications and tools to store, manipulate, analyze and display environmental information.
1. NCSA Mosaic Common Client Interface (CCI) NCSA - National Center for Supercomputing Applications http://www.ncsa.uiuc.edu/SDG/Software/XMosaic/CCI/cci-spec.html
2. Common Gateway Interface (CGI) NCSA - National Center for Supercomputing Applications http://hoohoo.ncsa.uiuc.edu/cgi/overview.html
3. The Computer Graphics Metafile (CGM) Advisory Group on Computer Graphics (AGOCG) http://www.agocg.ac.uk:8080/agocg/CGM.html
4. Spatial Interfaces with Computer Graphics Metafile (CGM) Environmental Resources Information Network (ERIN) http://www.erin.gov.au/gis/develop/cgm/spatial_cgm.html
5. The Second International WWW Conference '94 Chicago, USA (October, 1994) http://www.ncsa.uiuc.edu/SDG/IT94/IT94Info.html
6. The Client-Side Image Map HTML Extension Seidman, James L. Spyglass, Inc. (January, 1994) http://www.spyglass.com:4040/newtechnology/mapspec.htm
7. Cape York Peninsula Land Use Strategy (CYPLUS) http://www.erin.gov.au/land/regions/cyplus/cyplus.html
8. Environmental Resources Information Network (ERIN) http://www.erin.gov.au/
10. ERIN Spatial Interface Environmental Resources Information Network http://www.erin.gov.au/cgi-bin/spatial_interface
10. ERIN Technical Documentation Environmental Resources Information Network http://www.erin.gov.au/technical/contents.html
11. ERIN Technical References Environmental Resources Information Network http://www.erin.gov.au/technical/references/contents.html
12. HTML 3.0 - FIGure Element Internet Engineering Task Force (IETF) Draft http://www.hp.co.uk/people/dsr/html3/figures.html
13. HTML 3.0 - Fill-out Forms Internet Engineering Task Force (IETF) Draft http://www.hp.co.uk/people/dsr/html3/forms.html
14.
GD
Boutell, Thomas
http://siva.cshl.org/gd/gd.html
15. GD InTerpreter Harvey-George, David (1994) http://www.demon.co.uk/3Wiz/gdit/
16. Graphics Formats for WWW World Wide Web Consortium http://www.w3.org/hypertext/WWW/Graphics/Overview.html
17. HotJava SUN Microsystems http://java.sun.com/
18. HyperText Markup Language Specification Version 3.0 Internet Engineering Task Force (IETF) Draft http://www.hp.co.uk/people/dsr/html3/CoverPage.html
19. Interim Biogeographic Regionalisation of Australia (IBRA) Australian Nature Conservation Agency (ANCA) http://www.erin.gov.au/dsdl/data/ANCA/Regions:Biogeographic_IBRA_1.0.HTML
20. NCSA Imagemap Tutorial National Center for Supercomputing Applications (NCSA) http://hoohoo.ncsa.uiuc.edu/docs/setup/admin/Imagemap.html
21. ERIN Technical Documentation: Image Mapping Environmental Resources Information Network (ERIN) http://www.erin.gov.au/technical/CGI/image_mapping/image_mapping.html
22. Canadian National Atlas Information Service (NAIS) http://ellesmere.ccm.emr.ca/naismap/naismap.html
23. Xerox PARC Map Viewer Xerox Palo Alto Research Center (PARC) http://pubweb.parc.xerox.com/map
24. About the "perl" programming language Environmental Resources Information Network (ERIN) http://www.erin.gov.au/gis/develop/perl_library/about_perl.html
25. HTML 3.0 - Forms: Input Internet Engineering Task Force (IETF) Draft http://www.hp.co.uk/people/dsr/html3/input.html
26. Interactive species distribution reporting, mapping and modelling using the World Wide Web Boston, Tony and Stockwell, David (1994) Second International WWW Conference. Chicago. USA. http://www.erin.gov.au/database/WWW-Fall94/species_paper.html
27. A Dynamic GIS Interface Argonne National Laboratory http://www.dis.anl.gov:8001/GIS/stgis.html
28. Map-based access to Spatial Data using HotJava http://h2o.er.usgs.gov:80/public/hjdemo/master.html
29. Simple Vector Format (SVF) SoftSource http://www.softsource.com/softsource/vector.html
30. Australian World Heritage Areas Australian Department of the Environment, Sport and Territories http://www.erin.gov.au/land/conservation/wha/auswha.html
31. ERIN TEchnical Documentation: WWW Graphics and Map Images Environmental Resources Information Network (ERIN) http://www.erin.gov.au/technical/CGI/graphics/graphics.html