Uploads by Charles
This special page shows all uploaded files.
| Date | Name | Thumbnail | Size | Description | Versions |
|---|---|---|---|---|---|
| 15:49, 1 May 2015 | SVG-UC-Network.svg (file) | 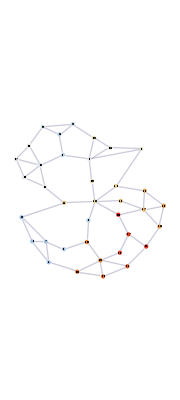 |
12 KB | A 37-node network. The points numbered 0-36 are coloured according to a gradient, where 0 is blue, moving through grey, yellow, and orange, with 36 red. The connections are apparently non-directional and all the same unless distance is significant, wit... | 1 |
| 15:06, 1 May 2015 | SVG-UC-DecisionFlow.svg (file) | 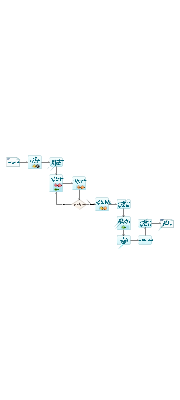 |
26 KB | added missing offset attributes in stop elements in linear gradients | 2 |
| 06:11, 1 May 2015 | SVG-UC-Canada.svg (file) | 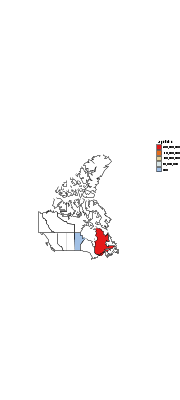 |
47 KB | added missing offset attributes to stop elements in linear gradients | 2 |
| 06:03, 1 May 2015 | SVG-UC-Area.svg (file) | 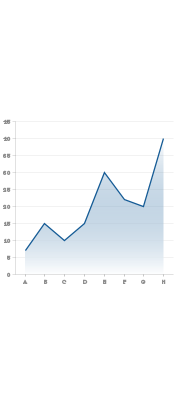 |
5 KB | Added missing offset values to stop elements in gradients | 2 |
| 05:58, 1 May 2015 | SVG-UC-Bar.svg (file) | 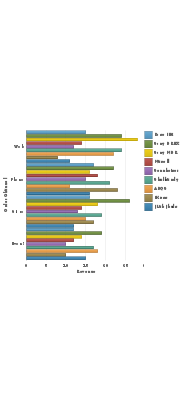 |
17 KB | added missing offset attributes to stop elements in gradients. | 2 |
| 05:54, 1 May 2015 | SVG-UC-Airline.svg (file) | 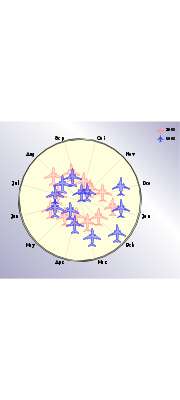 |
49 KB | 4 | |
| 05:25, 27 April 2015 | SVG-UC-EngineMount.svg (file) | 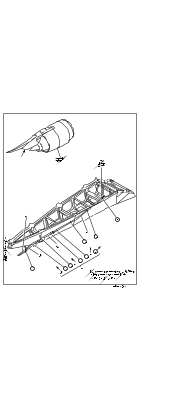 |
92 KB | changed a CGM element into a comment | 2 |
| 11:29, 13 April 2015 | SVG-UC-Dag.svg (file) | 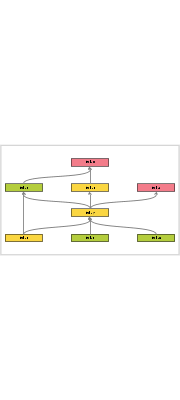 |
7 KB | An abstract directed node graph, with 8 nodes in 3 colours. The nodes are arranged in 4 partially-empty rows - the top and third row only have a node in the centre. All connection arrows move upward * On the bottom, Nodes 5 and 6, in green, only connec... | 1 |
| 10:28, 13 April 2015 | SVG-UC-CubaRoads.svg (file) | 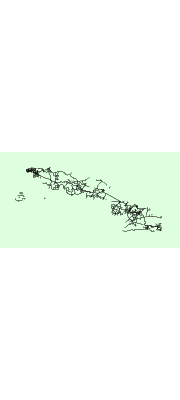 |
93 KB | Lines representing the roads in Cuba. (I think). | 1 |
| 09:52, 13 April 2015 | SVG-UC-ClusterBar3levels.svg (file) | 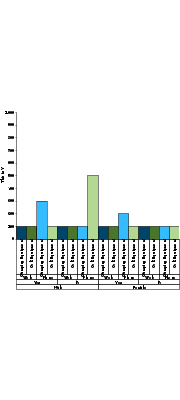 |
8 KB | Another example of a bar chart with multiple layers of information. The Y axis is numeric, the X axis is divided first inot male and female, in each part that is divided into yes and no, each of those is divided into web and phone, and each of those is... | 1 |
| 09:45, 13 April 2015 | SVG-UC-ClusterBar.svg (file) | 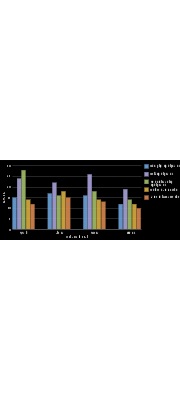 |
8 KB | Another bar chart. The Y axis is numeric, describing revenue, the X-axis contains 4 clusters of 5 bars each. The clusters represent the source of orders (web, phone, etc) groups, the individual bars, colour coded and identified by a legend, represent d... | 1 |
| 17:47, 10 April 2015 | SVG-UC-Chord.svg (file) | 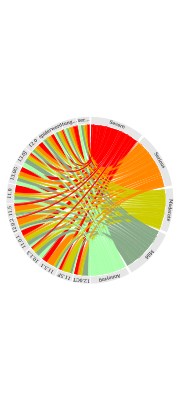 |
35 KB | A circle. With a tangle in the middle. Around the perimeter, each half of the circle essentially represents a set of things by dividin the arc into labeled pieces, and the tangle is made by connecting the things on the right half, where there are few... | 1 |
| 17:31, 10 April 2015 | SVG-UC-Revisedrec.svg (file) | 5 KB | A flowchart from the W3C process document, of how a Recommendation can be revised. Decision points include whether there are changes to the text (if not it can be republished) and whether they are substantive - which requires returning at least to PR, ... | 1 | |
| 17:16, 10 April 2015 | SVG-UC-Calendar.svg (file) | 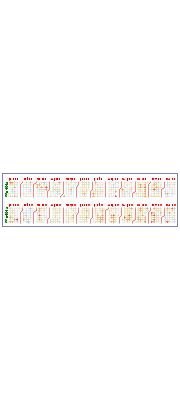 |
58 KB | A calendar for 1977 and 1978. The Y axis lists the days as MTWTFSS twice, once for each year, and the X axis lists the months - it is repeated for each year, e.g. the first X axis starts jan77, the second jan78. Each month is represented as a block of... | 1 |
| 17:10, 10 April 2015 | SVG-UC-Boxplot.svg (file) | 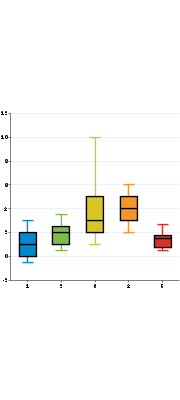 |
5 KB | Presumably this thing is known as a box plot. X axis goes from one to five (no units or meaning is provided for the example), and for each value there is a range covered on the Y axis by a vertical line with terminals. Within the range there is a highl... | 1 |
| 12:18, 8 April 2015 | SVG-UC-rectrack.svg (file) | 3 KB | The path a document takes through teh W3C process to Recommendation | 1 | |
| 17:50, 5 April 2015 | SVG-UC-3graphs.svg (file) | 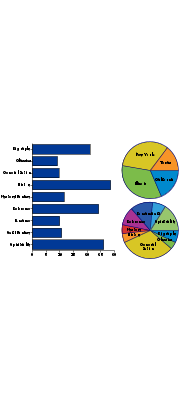 |
8 KB | A bar chart and two pie charts... | 1 |