SVG Accessibility/Mapping Graphs
Maps, whether of physical places or schematic metro maps or organisation charts
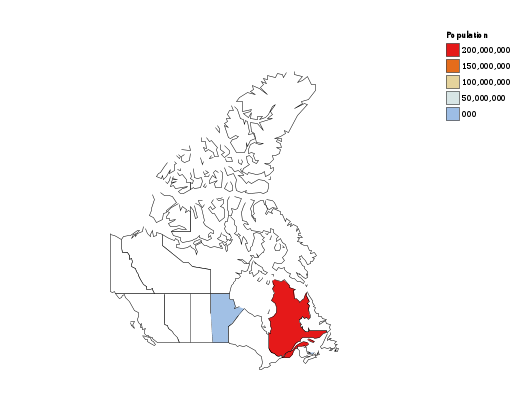
UC-Canada

A map of Canadian provinces. The legend suggests it is a population map, with colours representing differet levels of population, but only two provinces are coloured in. It might be broken with poorly-defined gradients
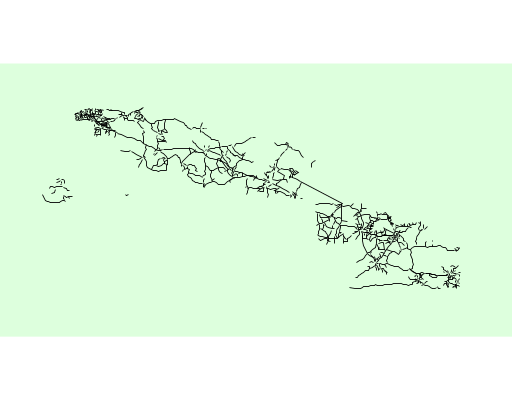
UC-CubaRoads

Lines representing the roads in Cuba - but nothing indicating boundaries such as "the shape of Cuba". (I think. Otherwise, it is a picture of where a snail went on a window over a few months).
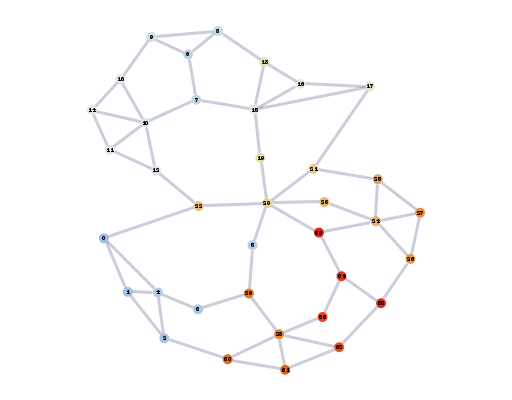
UC-Network

The points numbered 0-36 are coloured according to a gradient, where 0 is blue, moving through grey, yellow, and orange, with 36 red.
The connections are apparently non-directional and all the same unless distance is significant, with each node being connected to the following neighbours
- 0 connects to
- 1, 4, 22
- 1 connects to
- 0, 2, 4
- 2 connects to
- 1, 4, 30
- 3 connects to
- 4, 29
- 4 connects to
- 0, 1, 2, 3
- 5 connects to
- 20, 29
- 6 connects to
- 7, 8, 9
- 7 connects to
- 6, 10, 15
- 8 connects to
- 6, 9, 18
- 9 connects to
- 6, 8, 13
- 10 connects to
- 7, 11, 12, 13, 14
- 11 connects to
- 10, 12, 14
- 12 connects to
- 10, 11, 22
- 13 connects to
- 9, 10, 14
- 14 connects to
- 10, 11, 13
- 15 connects to
- 7, 16, 17, 18, 19
- 16 connects to
- 15, 17, 18
- 17 connects to
- 15, 16, 21
- 18 connects to
- 8, 15, 16
- 19 connects to
- 15, 20
- 20 connects to
- 5, 19, 21, 22, 23, 36
- 21 connects to
- 17, 20, 25
- 22 connects to
- 0, 12, 20
- 23 connects to
- 20, 24
- 24 connects to
- 23, 25, 26, 27, 36
- 25 connects to
- 21, 24, 27
- 26 connects to
- 24, 27, 35
- 27 connects to
- 24, 25, 26
- 28 connects to
- 29, 30, 31, 32, 33
- 29 connects to
- 3, 5, 28
- 30 connects to
- 2, 28, 31
- 31 connects to
- 28, 30, 32
- 32 connects to
- 28, 31, 35
- 33 connects to
- 28, 34
- 34 connects to
- 33, 35, 36
- 35 connects to
- 26, 32, 34
- 36 connects to
- 20, 24, 34