
File:SVG-UC-Boxplot.svg

Size of this PNG preview of this SVG file: 512 × 512 pixels.
Original file (SVG file, nominally 512 × 512 pixels, file size: 5 KB)
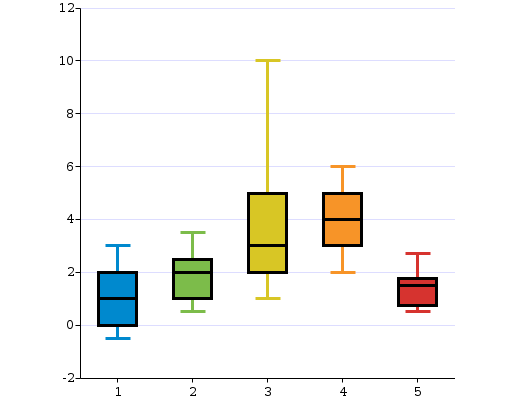
Presumably this thing is known as a box plot. X axis goes from one to five (no units or meaning is provided for the example), and for each value there is a range covered on the Y axis by a vertical line with terminals. Within the range there is a highlighted range, represented by a box placed over the line, and within the box a horizontal dividing line may identify a particularly key value such as mean, median, or what we though made the box look nicer.
File history
Click on a date/time to view the file as it appeared at that time.
| Date/Time | Thumbnail | Dimensions | User | Comment | |
|---|---|---|---|---|---|
| current | 17:10, 10 April 2015 | | 512 × 512 (5 KB) | Charles (talk | contribs) | Presumably this thing is known as a box plot. X axis goes from one to five (no units or meaning is provided for the example), and for each value there is a range covered on the Y axis by a vertical line with terminals. Within the range there is a highl... |
You cannot overwrite this file.
File usage
The following page uses this file: