Validating User Modelling Web Service
- Pradipta Biswas & Pat Langdon, University of Cambridge, UK, pb400@cam.ac.uk
Introduction
This paper presents a study on making an icon searching interface accessible through a user modelling web service. Designers can use our results either to improve designs of iconic interfaces for elderly users or developing similar user profile based adaptations for their own applications.
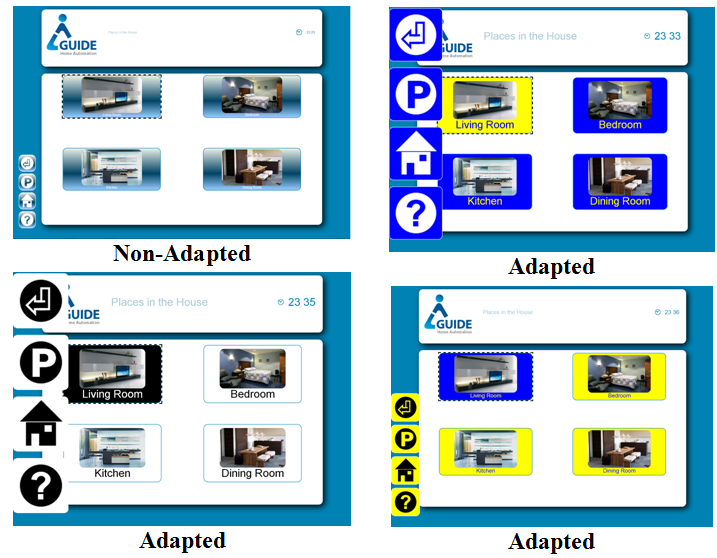
We have developed a set of user modelling web services [1] that can dynamically adjust font size, cursor size, colour contrast, audio volume (for DTV systems) and spacing between interface elements (Figure 1). Detail of the user model can be found in a separate paper by the same authors in this UM4A proceeding. In this paper, we have validated the user modelling web service through a simple point and click task. The task is kept simple to ensure the statistical effect we observed in the trial is only due to the experimental conditions and not due to difficulty in learning the task.
Participants
We collected data from the following twelve users (average age: 56.92 years, male to female ratio 7:5) with physical or age related impairment (Table 1). The selection criteria of participants was either more than 60 years old or having physical impairment. These users were recruited through a local user organization in UK, they all use computers or laptops everyday and volunteered for the study.
| Participants | Age | Sex | Impairment |
|---|---|---|---|
| P1 | 44 | M | Tunnel Vision, Spasm in finger |
| P2 | 48 | M | CerebralPalsy |
| P3 | 57 | F | CerebralPalsy |
| P4 | 34 | M | Polio |
| P5 | 45 | M | Spina Bifida |
| P6 | 48 | F | Spina Bifida |
| P7 | 73 | M | Glaucoma, age related dementia |
| P8 | 60 | M | Age related visual impairment |
| P9 | 69 | F | Age related visual impairment |
| P10 | 65 | F | Age related visual impairment |
| P11 | 63 | M | Age related visual impairment |
| P12 | 77 | F | Blurred vision due to droops in lower eye-lids, protanomalous colour blindness |
Design
The study simulates a situation of pointing and clicking in a direct manipulation interface. For example, users often click an icon on desktop to open a folder and then click another time to select the required file. This study first showed users a couple of familiar icons and then asked them to click on these two icons from a list of icons. The list of icons was presented in three different ways. In one case they use the default parameter settings (font size, button spacing) of Windows 7 operating system. In the other two cases the layout was adapted following predictions from the user model.
We considered two different organizations of icons in the adapted versions – elliptical and rectangular. Figure 2 below shows examples of the control and adapted versions of the icon searching screens. The elliptical arrangement requires more visual search time but it has less probability of accidental clicking on wrong icons by motor impaired users as the pointing path does not contain multiple icons. The rectangular arrangement is more familiar than the elliptical one. In both adapted versions, we changed the font size and button spacing according to the algorithms discussed above. The button labels are also presented in higher contrast for colour blind users. The gravity well and exponential averaging algorithms [3] were activated according to the Adaptation Selection algorithm in previous section. Users also followed predictions from the user model in choosing the appropriate input devices in adapted conditions.
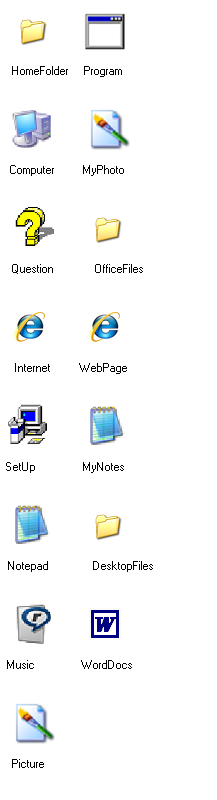 Control Condition |
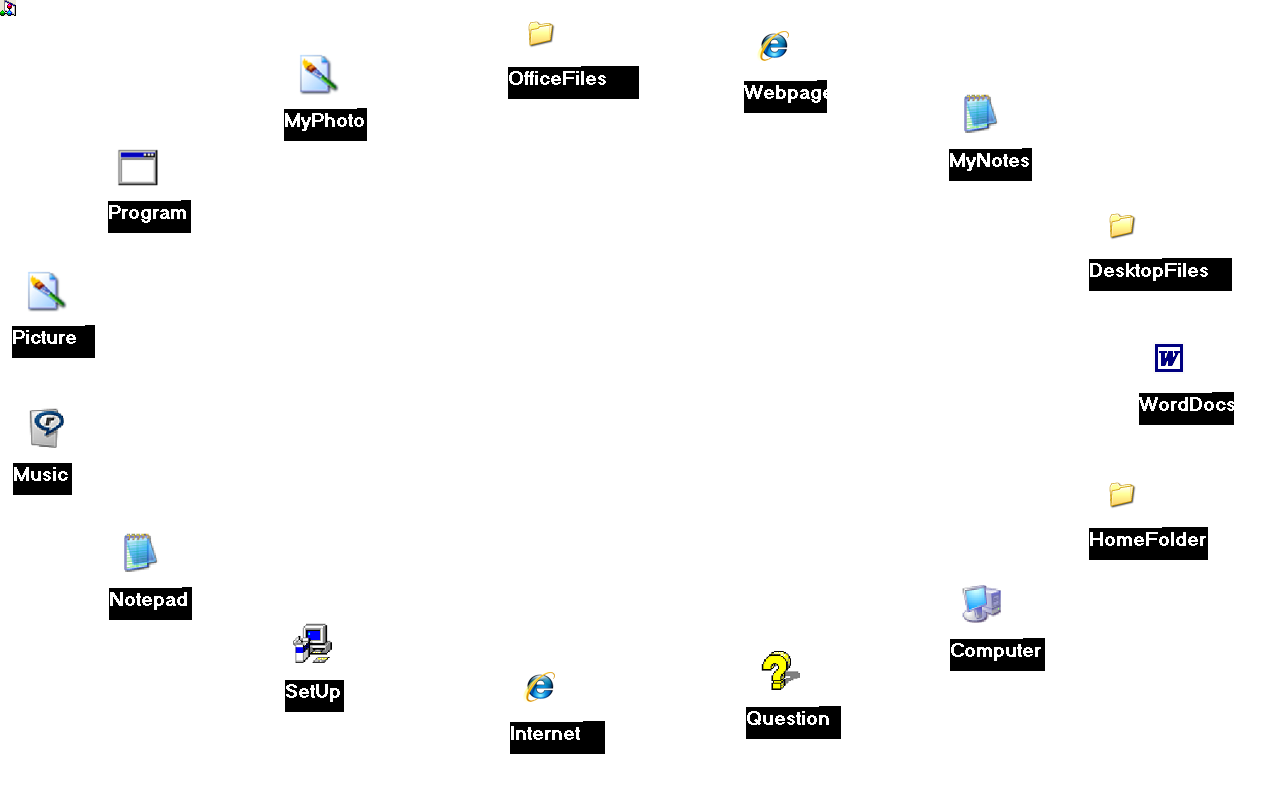 Adapted Elliptical Condition |
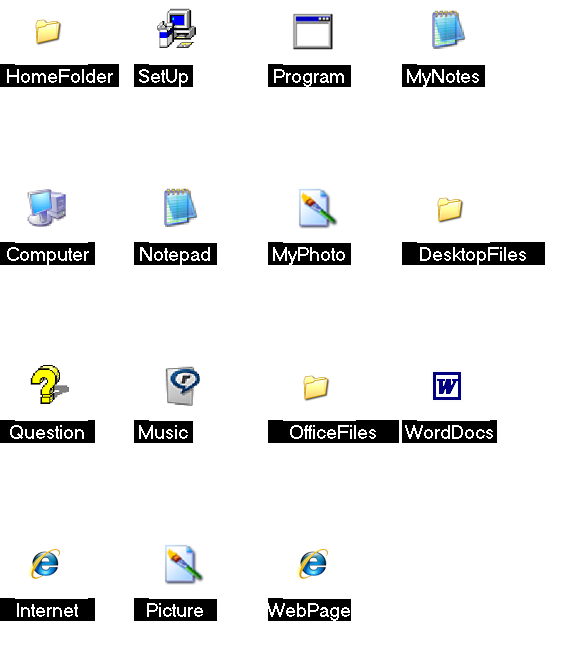 Adapted Rectangular Condition |
Material
The study was conducted using a computer and a Tablet device. Both of these devices had Windows 7 operating system. The computer has a 20” screen with 1280 ´ 1024 pixel resolution while the Tablet had a 10” screen with 1280 ´ 800 pixel resolution. The participants used a standard mouse and their fingers with the tablet touchscreen in control condition, while they were allowed to use a TrackBall and Stylus in experimental condition based on the prediction from the user model.
Procedure
Initially the participants used part of the UIA to create a user profile. Then they undertook the icon searching task. The control (non-adapted) and experimental (adapted) conditions were randomly chosen. For each screen, participants needed to remember two icons and click on them. Each participant used both computer and Tablet. They undertook 10 icon searching tasks under each condition for each device. Each user performed 80 pointing tasks, used both computer and tablet and the icons were randomly selected from a pool of 10 icons. We measured the time interval between presentations of the screen of icons and the event of clicking on an icon.
Results
Figures 3 and 4 shows average pointing times and number of correct selections for all different conditions. The Y bars signify standard deviation. Initially we found that 9 out of 12 users selected more correct icons and took less time to point in one of the adapted conditions than the control conditions for both PC and Tablet, while they selected the first icon. During selection of the second icon, 10 out of 12 users in PC and 12 out of 12 users for Tablet selected more correct icons and took less time to point in one of the adapted conditions than the control conditions.
We have further analyzed the pointing times and number of correct icon selection through ANOVA and MANOVA tests. The structure of these tests were as follows
Device X Condition X Selection
Device has two levels: PC and Tablet
Condition has four levels: Control, Adapted Elliptical, Adapted Rectangular and AdaptedMerged. The last condition aims to merge the different adaptation conditions into one. Users preferred and performed better in one of the elliptical or rectangular conditions, the last condition (AdaptedMerged) considers the better performance (less pointing time and more correct selection) between elliptical and rectangular conditions.
Selection has two levels: First selection and Second selection, as users needed to select two icons each time.
We have the following significant effects in the Within-Subject Test
- As expected Selection has a significant effect for both correct icon selection and pointing time. Users selected less number of correct icons and took more time to click the second icon than the first icon.
- A main effect of Condition for correct icon selection, F (1.84, 20.24) = 3.74, p< 0.05, η² = 0.25 after applying Greenhouse-Geisser correction. The effect of condition for pointing time tends to significance, F(3, 11)= 2.83, p = 0.05, η² = 0.20.
- A main effect of Device for correct icon selection, F(1,11) = 5.21, p< 0.05, η² = 0.32
- An interaction effect of Device ´ Selection for correct icon selection, F(1,11) = 5.52, p < 0.05, η² = 0.33
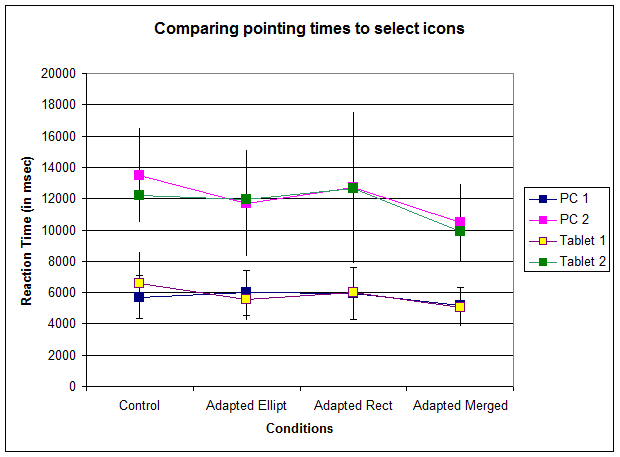
Figure 3. Comparing average pointing times
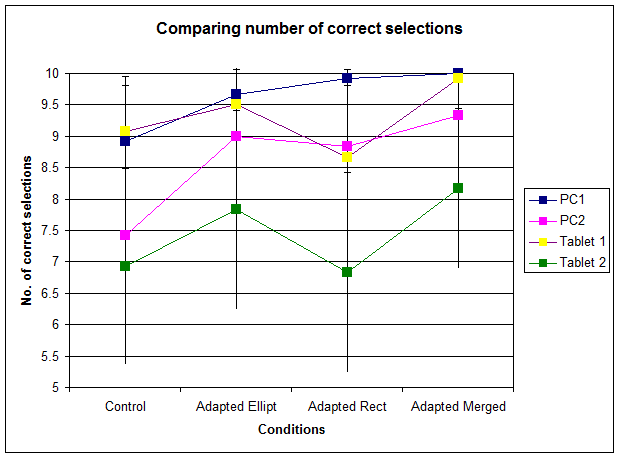
Figure 4. Comparing number of correct icon selections
Discussion
The control condition packed icons in a small portion of the screen due to reduced font size and button spacing. It may be expected that this condition would require less eye gaze and pointer movements than adapted versions, which spread out the icons throughout the screen. However, users selected more correct icons in one of the adapted conditions than control condition with statistical significance and their pointing times were not compromised due to spreading up the icons in the screen as the differences in pointing times with control condition were not significant, rather on average it was less in AdaptedMerged condition than Control condition. It shows that the increased font size, button spacing and colour contrast helped users to remember, search, point and click on them. We have found that users took more time to remember the second icon, which can be attributed to the fact that many of our participants have age or cerebral palsy related dementia. Users selected more correct icons in the PC than in tablet, especially during selecting the second icon. This is due to the fact that many of our participants had more experience with PC than with Tablet device. However their pointing times to select correct icons were not significantly different between PC and Tablet. Regarding subjective preference, 6 users preferred Elliptical arrangements of buttons while 5 preferred rectangular and one had no preference. All of them preferred one of the adapted conditions more usable than the control condition. Overall, the study proves the usefulness of the user modelling web service in adapting interfaces for two different devices.
References
- P. Biswas and P. Langdon, Inclusive user modelling, A Multimodal End-2-End Approach to Accessible Computing, Springer
- The GUIDE Project, URL: http://www.guide-project.eu/, Accessed on 23rd March 2013.
- Biswas P. and Langdon P., Investigating the gravity well algorithm to help in pointing in electronic interfaces by motor-impaired users, Journal of Assistive Technologies 5(3), 2011, ISSN: 1754-9450