Warning:
This wiki has been archived and is now read-only.
BP Data Enrichment
Introduction
Data enrichment refers to processes used to enhance, refine or otherwise improve raw data. This idea and other similar concepts contribute to making data a valuable asset for almost any modern business or enterprise. It also shows the common imperative of proactively using this data in various ways. There are several motivations to deal with this data enrichment process, which can be summarized by main characteristics of the huge amount of data originated by Web 2.0 applications. Thus, we are talking about big data and different user and business demands to deal with it! In this context, we are dealing with different data characteristics, such as volume, diversity or variety, velocity, variability, and complexity. Big data can be described by the following characteristics:
- Volume: the “Big” word in Big data itself defines the volume. At present the data existing is in petabytes (10^15) and is supposed to increase to zettabytes (10^21) in nearby future. Data volume measures the amount of data available to an organization, which does not necessarily have to own all of it as long as it can access it.
- Data Velocity: in Big data velocity is a concept which deals with the speed of the data coming from various sources. This characteristic is not being limited to the speed of incoming data but also speed at which the data flows and aggregated
- Data Variety: is a measure of the richness of the data representation – text, images, video, audio, etc. Data being produced is not of single category as it not only includes the traditional data but also the semi structured data from various resources like web Pages, Web Log Files, social media sites, e-mail, documents.
- Data Value: measures the usefulness of data in making decisions. Data science is exploratory and useful in getting to know the data, but “analytic science” encompasses the predictive power of big data. User can run certain queries against the data stored and thus can deduct important results from the filtered data obtained and can also rank it according to the dimensions they require. These reports help these people to find the business trends according to which they can change their strategies.
- Complexity: measures the degree of interconnectedness (possibly very large) and interdependence in big data structures such that a small change (or combination of small changes) in one or a few elements can yield very large changes or a small change that ripple across or cascade through the system and substantially affect its behavior, or no change at all (Katal, Wazid, & Goudar, 2013).
In order to deal with different data originated by Web applications, especially from user-generated content (UGC), there are different computational tasks that we have to perform. Such tasks determine the data enrichment process.
Data Enrichment Tasks
In this section we present the main data enrichment tasks, describing each one. These tasks are inherited from a data-centric view, as illustrated by Figure 1.
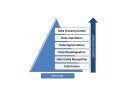
Figure 1: Data enrichment tasks
The data enrichment process, as showed by Figure 2, consists of applying one or more tasks in an independent way, where the data D are transformed in data D´ as a result of one data enrichment task. This can be a cyclic process, providing more data structure as the tasks are performed.
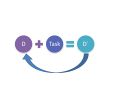
Figure 2: Data enrichment process