The script in ../util/nt2dot.rb is handy for turning N-Triples into a form GraphViz can understand.
From xml-dist-app:
In Message-ID: <005601c1cd05$9a982f80$b47ba8c0@zerogravitas>
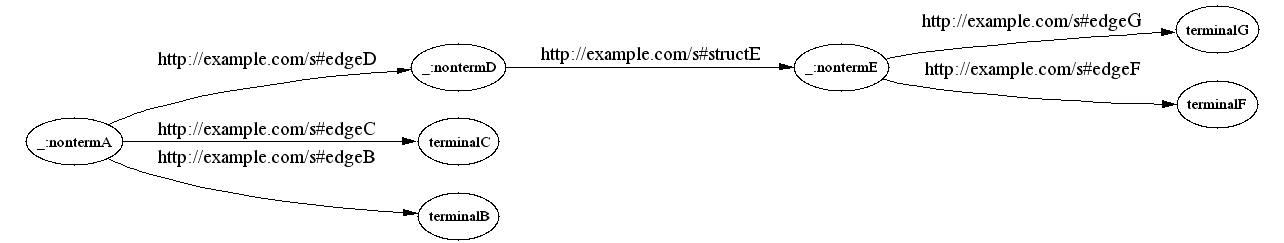
Using your triples the graph would look like this:
    nontermA edgeB "terminalB"
    nontermA edgeC "terminalC"
    nontermA edgeD "nontermD"
    nontermD structE "nontermE"
    nontermE edgeF "terminalF"
    nontermE edgeG "terminalG"
What I typed...

danbri@fireball:~/s-rubyrdf/util > ./nt2dot.rb < gudge1.nt > gudge1.dot
danbri@fireball:~/s-rubyrdf/util > dot -Tpng gudge1.dot > gudge1.png
danbri@fireball:~/s-rubyrdf/util > dot -Tsvg gudge1.dot > gudge1.svg